Lululemon 2010 Annual Report Download - page 76
Download and view the complete annual report
Please find page 76 of the 2010 Lululemon annual report below. You can navigate through the pages in the report by either clicking on the pages listed below, or by using the keyword search tool below to find specific information within the annual report.
Table of Contents
lululemon athletica inc. and Subsidiaries
NOTES TO THE CONSOLIDATED FINANCIAL STATEMENTS — (Continued)
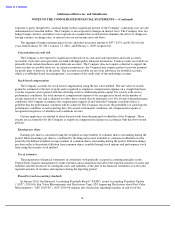
Company stock options and performance stock units
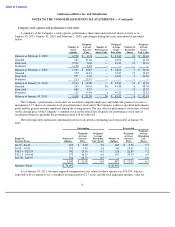
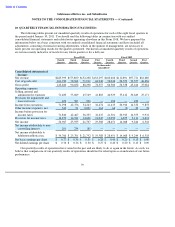
A summary of the Company’s stock options, performance share units and restricted shares activity as of
January 30, 2011, January 31, 2010, and February 1, 2009, and changes during the years then ended is presented
below:
The Company’s performance stock units are awarded to eligible employees and entitle the grantee to receive a
maximum of 1.5 shares of common stock per performance stock unit if the Company achieves specified performance
goals and the grantee remains employed during the vesting period. The fair value of performance stock units is based
on the closing price of the Company’s common stock on the award date. Expense for performance stock units is
recognized when it is probable the performance goal will be achieved.
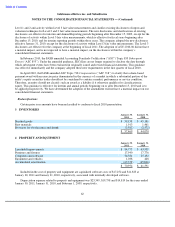
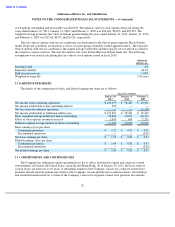
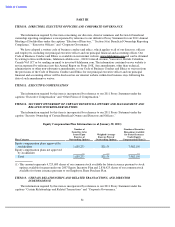
The following table summarizes information about stock options outstanding and exercisable at January 30,
2011:
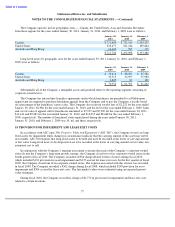
As of January 30, 2011, the unrecognized compensation cost related to these options was $15,399, which is
expected to be recognized over a weighted-average period of 2.7 years; and the total aggregate intrinsic value for
71
Weighted
-
Weighted
-
Weighted
-
Number of
Average
Number of
Average
Number of
Average
Stock
Exercise
Performance
Grant
Restricted
Grant
Options
Price
Share Units
Fair Value
Shares
Fair Value
Balance at February 3, 2008
4,798
$
2.74
—
$
19.43
10
$
19.43
Granted
545
21.66
—
24.04
9
24.04
Exercised
2,310
0.62
—
19.43
10
19.43
Forfeited
1,128
2.49
—
—
—
—
Balance at February 1, 2009
1,905
$
10.83
—
$
24.04
9
$
24.04
Granted
959
14.81
—
13.83
15
13.83
Exercised
557
2.23
—
24.04
9
24.04
Forfeited
113
23.57
—
—
—
—
Balance at January 31, 2010
2,194
$
14.08
—
$
13.83
15
$
13.83
Granted
245
50.63
84
41.88
6
38.74
Exercised
684
8.75
—
—
15
15.33
Forfeited
125
17.44
4
41.22
2
13.83
Balance at January 30, 2011
1,630
$
21.59
80
$
41.92
4
$
42.43
Outstanding
Exercisable
Weighted
-
Weighted
-
Weighted-
Weighted
-
Average
Average
Average
Average
Remaining
Range of
Number of
Exercise
Remaining
Number of
Exercise
Life
Exercise Prices
Options
Price
Life (Years)
Options
Price
(Years)
$0.49
-
$0.60
185
$
0.58
5.9
185
$
0.58
5.9
$6.98
-
18.00
529
9.99
5.6
69
14.01
6.5
$18.91
-
$29.20
542
23.76
6.7
126
22.59
7.2
$32.31
-
$50.46
270
36.25
6.6
107
33.79
6.9
$67.00
-
$
69.87
104
68.72
6.9
—
—
0.0
1,630
$
21.59
6.3
487
$
15.47
6.5
Intrinsic Value
$
76,692
$
26,001


