Hertz 2015 Annual Report Download - page 64
Download and view the complete annual report
Please find page 64 of the 2015 Hertz annual report below. You can navigate through the pages in the report by either clicking on the pages listed below, or by using the keyword search tool below to find specific information within the annual report.-
 1
1 -
2
-
3
-
4
-
5
-
6
-
7
-
8
-
9
-
10
-
11
-
12
-
13
-
14
-
15
-
16
-
17
-
18
-
19
-
20
-
21
-
22
-
23
-
24
-
25
-
26
-
27
-
28
-
29
-
30
-
31
-
32
-
33
-
34
-
35
-
36
-
37
-
38
-
39
-
40
-
41
-
42
-
43
-
44
-
45
-
46
-
47
-
48
-
49
-
50
-
51
-
52
-
53
-
 54
54 -
 55
55 -
 56
56 -
 57
57 -
 58
58 -
 59
59 -
 60
60 -
 61
61 -
 62
62 -
 63
63 -
 64
64 -
 65
65 -
 66
66 -
 67
67 -
 68
68 -
 69
69 -
 70
70 -
 71
71 -
 72
72 -
 73
73 -
 74
74 -
75
-
76
-
77
-
78
-
79
-
80
-
81
-
82
-
83
-
84
-
85
-
86
-
87
-
88
-
89
-
90
-
91
-
92
-
93
-
94
-
95
-
96
-
97
-
98
-
99
-
100
-
101
-
102
-
103
-
104
-
105
-
106
-
107
-
108
-
109
-
110
-
111
-
112
-
113
-
114
-
115
-
116
-
117
-
118
-
119
-
120
-
121
-
122
-
123
-
124
-
125
-
126
-
127
-
128
-
129
-
130
-
131
-
132
-
133
-
134
-
135
-
136
-
137
-
138
-
139
-
140
-
141
-
142
-
143
-
144
-
145
-
146
-
147
-
148
-
149
-
150
-
151
-
152
-
153
-
154
-
155
-
156
-
157
-
158
-
159
-
160
-
161
-
162
-
163
-
164
-
165
-
166
-
167
-
168
-
169
-
170
-
171
-
172
-
173
-
174
-
175
-
176
-
177
-
178
-
179
-
180
-
181
-
182
-
183
-
184
-
185
-
186
-
187
-
188
-
189
-
190
-
191
-
192
-
193
-
194
-
195
-
196
-
197
-
198
-
199
-
200
-
201
-
202
-
203
-
204
-
205
-
206
-
207
-
208
-
209
-
210
-
211
-
212
-
213
-
214
-
215
-
216
-
217
-
218
-
219
-
220
-
221
-
222
-
223
-
224
-
225
-
226
-
227
-
228
-
229
-
230
-
231
 |
 |

Table of Contents
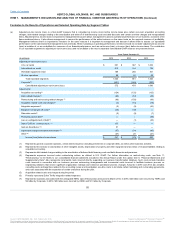
(8) Represents non-recurring costs incurred in connection with the relocation of the Company's corporate headquarters to Estero, Florida that were not included
in restructuring expenses. Such expenses primarily include duplicate facility rent, certain moving expenses, and other costs that are direct and incremental
due to the relocation.
(9) In 2013, represents premiums paid to redeem our 8.50% Former European Fleet Notes.
(10) In 2013, represents extinguishment of debt for Senior Convertible Notes.
(11) In 2015, represents the pre-tax gain on the sale of approximately 138 million shares of CAR Inc. common stock.
(12) In 2015, represents the pre-tax gain on the sale of our HERC France and Spain businesses.
(13) In 2015, primarily comprised of a $40 million write down of the HERC trade name. Also includes a $6 million impairment on the former Dollar Thrifty
headquarters in Tulsa, Oklahoma, a $5 million impairment on a building in the U.S. Car Rental segment, $3 million impairment on a held for sale corporate
asset, and write downs of $3 million associated with U.S. Car Rental service equipment and assets. In 2014, primarily comprised of a $13 million impairment
related to our former corporate headquarters building in New Jersey, a $10 million impairment of HERC revenue earning equipment held for sale and a $10
million impairment of assets related to a contract termination. In 2013, primarily related to a $40 million impairment in the carrying value of the vehicles
subleased to FSNA and its subsidiary, Simply Wheelz.
(14) Includes miscellaneous, non-recurring or non-cash items. For 2015, primarily represents a charge of $23 million recorded in relation to a French road tax
matter. In 2014, primarily comprised of a $19 million litigation settlement received in relation to a class action lawsuit filed against an original equipment
manufacturer. In 2013, primarily represents cash premiums of $12 million associated with the conversion of the Senior Convertible Notes and $5 million of
depreciation expense related to HERC.
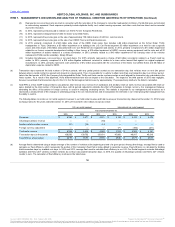
(b) Transaction days represent the total number of 24-hour periods, with any partial period counted as one transaction day, that vehicles were on rent (the period
between when a rental contract is opened and closed) in a given period. Thus, it is possible for a vehicle to attain more than one transaction day in a 24-hour period.
Late in the third quarter of 2015 the Company fully integrated the Dollar Thrifty and Hertz counter systems and as a result aligned the transaction day calculation in the
Hertz system. As a result of this alignment, Hertz determined that there was an impact to the calculation. The impact to the third quarter of 2015 was negligible,
however we estimate that transaction days for the U.S. Car Rental segment will increase by approximately 1% prospectively relative to the historic calculation.
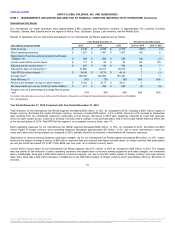
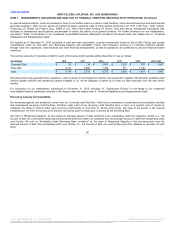
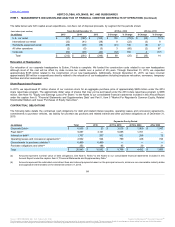
(c) Total RPD is a Non-GAAP measure that is calculated as total revenue less revenue from subleases and ancillary retail car sales revenue associated with retail car
sales, divided by the total number of transaction days, with all periods adjusted to eliminate the effect of fluctuations in foreign currency. Our management believes
eliminating the effect of fluctuations in foreign currency is useful in analyzing underlying trends. This statistic is important to our management and investors as it
represents a measurement of the changes in underlying pricing in the car rental business and encompasses the elements in car rental pricing that management has
the ability to control.
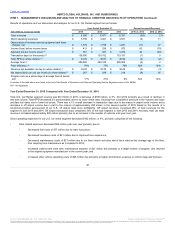
The following tables reconcile our car rental segment revenues to our total rental revenue and total revenue per transaction day (based on December 31, 2014 foreign
exchange rates) for the years ended December 31, 2015, 2014 and 2013 ($ in millions except as noted):
Revenues $ 6,286
$ 6,471
$ 6,331
$ 2,148
$ 2,436
$ 2,378
Advantage sublease revenue —
—
(65)
—
—
—
Ancillary retail car sales revenue (57)
(32)
(14)
—
—
—
Foreign currency adjustment —
—
—
171
(196)
(211)
Total rental revenue $ 6,229
$ 6,439
$ 6,252
$ 2,319
$ 2,240
$ 2,167
Transaction days (in thousands) 138,590
139,752
133,181
47,860
46,917
45,019
Total RPD (in whole dollars) $ 44.95
$ 46.07
$ 46.94
$ 48.45
$ 47.74
$ 48.14
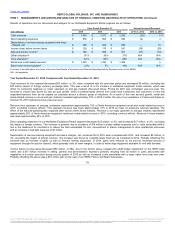
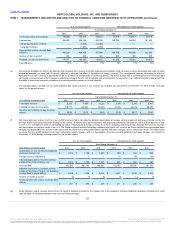
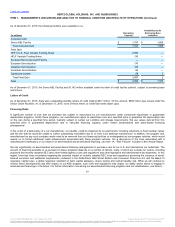
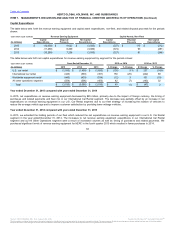
(d) Average fleet is determined using a simple average of the number of vehicles at the beginning and end of a given period. Among other things, average fleet is used to
calculate our fleet efficiency which represents the portion of the Company's fleet that is being utilized to generate revenue. Fleet efficiency is calculated by dividing
total transaction days by available car days. In 2014 and 2013, average fleet used to calculate fleet efficiency in our U.S. Car Rental segment excludes Advantage
sublease and Hertz 24/7 vehicles as these vehicles do not have associated transaction days. In 2015, the quantity of Advantage sublease and Hertz 24/7 vehicles
rounds to zero. The calculation of fleet efficiency is shown in the table below.
56
℠
The information contained herein may not be copied, adapted or distributed and is not warranted to be accurate, complete or timely. The user assumes all risks for any damages or losses arising from any use of this information,
except to the extent such damages or losses cannot be limited or excluded by applicable law. Past financial performance is no guarantee of future results.