Hertz 2015 Annual Report Download - page 48
Download and view the complete annual report
Please find page 48 of the 2015 Hertz annual report below. You can navigate through the pages in the report by either clicking on the pages listed below, or by using the keyword search tool below to find specific information within the annual report.-
 1
1 -
2
-
3
-
4
-
5
-
6
-
7
-
8
-
9
-
10
-
11
-
12
-
13
-
14
-
15
-
16
-
17
-
18
-
19
-
20
-
21
-
22
-
23
-
24
-
25
-
26
-
27
-
28
-
29
-
30
-
31
-
32
-
33
-
34
-
35
-
36
-
37
-
 38
38 -
 39
39 -
 40
40 -
 41
41 -
 42
42 -
 43
43 -
 44
44 -
 45
45 -
 46
46 -
 47
47 -
 48
48 -
 49
49 -
 50
50 -
 51
51 -
 52
52 -
 53
53 -
 54
54 -
 55
55 -
 56
56 -
 57
57 -
 58
58 -
59
-
60
-
61
-
62
-
63
-
64
-
65
-
66
-
67
-
68
-
69
-
70
-
71
-
72
-
73
-
74
-
75
-
76
-
77
-
78
-
79
-
80
-
81
-
82
-
83
-
84
-
85
-
86
-
87
-
88
-
89
-
90
-
91
-
92
-
93
-
94
-
95
-
96
-
97
-
98
-
99
-
100
-
101
-
102
-
103
-
104
-
105
-
106
-
107
-
108
-
109
-
110
-
111
-
112
-
113
-
114
-
115
-
116
-
117
-
118
-
119
-
120
-
121
-
122
-
123
-
124
-
125
-
126
-
127
-
128
-
129
-
130
-
131
-
132
-
133
-
134
-
135
-
136
-
137
-
138
-
139
-
140
-
141
-
142
-
143
-
144
-
145
-
146
-
147
-
148
-
149
-
150
-
151
-
152
-
153
-
154
-
155
-
156
-
157
-
158
-
159
-
160
-
161
-
162
-
163
-
164
-
165
-
166
-
167
-
168
-
169
-
170
-
171
-
172
-
173
-
174
-
175
-
176
-
177
-
178
-
179
-
180
-
181
-
182
-
183
-
184
-
185
-
186
-
187
-
188
-
189
-
190
-
191
-
192
-
193
-
194
-
195
-
196
-
197
-
198
-
199
-
200
-
201
-
202
-
203
-
204
-
205
-
206
-
207
-
208
-
209
-
210
-
211
-
212
-
213
-
214
-
215
-
216
-
217
-
218
-
219
-
220
-
221
-
222
-
223
-
224
-
225
-
226
-
227
-
228
-
229
-
230
-
231
 |
 |

Table of Contents
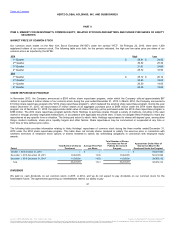
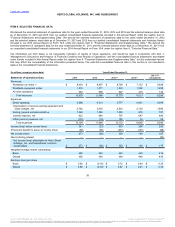
Cash and cash equivalents $ 486
$ 490
$ 411
$ 541
$ 919
Total assets 23,358
23,985
24,423
23,128
17,562
Total debt 15,907
15,993
16,309
15,449
11,317
Total equity 2,019
2,464
2,567
2,331
2,118
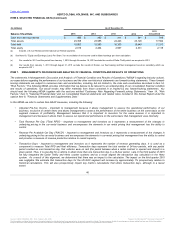
(a) Includes U.S. Car Rental and International Car Rental segments.
(b) See Note 18, "Equity and Earnings (Loss) Per Share," for reconciliation of net income used in diluted earnings per share calculation.
(c) Our results for 2011 and the period from January 1, 2012 through November 18, 2012 exclude the results of Dollar Thrifty which we acquired in 2012.
(d) Our results from January 1, 2011 through August 31, 2011 exclude the results of Donlen, our fleet leasing and fleet management services subsidiary which we
acquired in 2011.
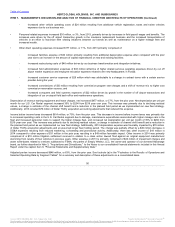
The statements in Management's Discussion and Analysis of Financial Condition and Results of Operations ("MD&A") regarding industry outlook,
our expectations regarding the performance of our business and the other non-historical statements are forward-looking statements. These forward-
looking statements are subject to numerous risks and uncertainties, including, but not limited to, the risks and uncertainties described in Item 1A,
"Risk Factors.” The following MD&A provides information that we believe to be relevant to an understanding of our consolidated financial condition
and results of operations. Our actual results may differ materially from those contained in or implied by any forward-looking statements. You
should read the following MD&A together with the sections entitled “Cautionary Note Regarding Forward-Looking Statements,” Item 1A, "Risk
Factors,” Item 6, "Selected Financial Data” and our consolidated financial statements and related notes included in this Annual Report under the
caption Item 8, "Financial Statements and Supplementary Data.”
In this MD&A we refer to certain Non-GAAP measures, including the following:
• Adjusted Pre-Tax Income - important to management because it allows management to assess the operational performance of our
business, exclusive of certain items and allows management to assess the performance of the entire business on the same basis as the
segment measure of profitability. Management believes that it is important to investors for the same reasons it is important to
management and because it allows them to assess our operational performance on the same basis that management uses internally.
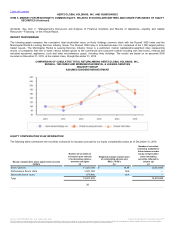
• Total Revenue Per Day ("Total RPD") - important to management and investors as it represents a measurement of the changes in
underlying pricing in the car rental business and encompasses the elements in car rental pricing that management has the ability to
control.
• Revenue Per Available Car Day ("RACD") - important to management and investors as it represents a measurement of the changes in
underlying pricing in the car rental business and encompasses the elements in car rental pricing that management has the ability to control
and provides a measure of revenue production relative to overall capacity.
• Transaction Days - important to management and investors as it represents the number of revenue generating days. It is used as a
component to measure Total RPD and fleet efficiency. Transaction days represent the total number of 24-hour periods, with any partial
period counted as one transaction day, that vehicles were on rent (the period between when a rental contract is opened and closed) in a
given period. Thus, it is possible for a vehicle to attain more than one transaction day in a 24-hour period. Late in the third quarter of 2015
we fully integrated the Dollar Thrifty and Hertz counter systems and as a result aligned the transaction day calculation in the Hertz
system. As a result of this alignment, we determined that there was an impact to the calculation. The impact on the third quarter 2015
was negligible. We estimate that transaction days for the US RAC segment will increase by approximately 1% prospectively relative to
historical calculations. This will also prospectively impact key metrics calculations that utilize transaction days, although to a lesser
extent.
40
℠
The information contained herein may not be copied, adapted or distributed and is not warranted to be accurate, complete or timely. The user assumes all risks for any damages or losses arising from any use of this information,
except to the extent such damages or losses cannot be limited or excluded by applicable law. Past financial performance is no guarantee of future results.