Hertz 2015 Annual Report Download - page 52
Download and view the complete annual report
Please find page 52 of the 2015 Hertz annual report below. You can navigate through the pages in the report by either clicking on the pages listed below, or by using the keyword search tool below to find specific information within the annual report.-
 1
1 -
2
-
3
-
4
-
5
-
6
-
7
-
8
-
9
-
10
-
11
-
12
-
13
-
14
-
15
-
16
-
17
-
18
-
19
-
20
-
21
-
22
-
23
-
24
-
25
-
26
-
27
-
28
-
29
-
30
-
31
-
32
-
33
-
34
-
35
-
36
-
37
-
38
-
39
-
40
-
41
-
 42
42 -
 43
43 -
 44
44 -
 45
45 -
 46
46 -
 47
47 -
 48
48 -
 49
49 -
 50
50 -
 51
51 -
 52
52 -
 53
53 -
 54
54 -
 55
55 -
 56
56 -
 57
57 -
 58
58 -
 59
59 -
 60
60 -
 61
61 -
 62
62 -
63
-
64
-
65
-
66
-
67
-
68
-
69
-
70
-
71
-
72
-
73
-
74
-
75
-
76
-
77
-
78
-
79
-
80
-
81
-
82
-
83
-
84
-
85
-
86
-
87
-
88
-
89
-
90
-
91
-
92
-
93
-
94
-
95
-
96
-
97
-
98
-
99
-
100
-
101
-
102
-
103
-
104
-
105
-
106
-
107
-
108
-
109
-
110
-
111
-
112
-
113
-
114
-
115
-
116
-
117
-
118
-
119
-
120
-
121
-
122
-
123
-
124
-
125
-
126
-
127
-
128
-
129
-
130
-
131
-
132
-
133
-
134
-
135
-
136
-
137
-
138
-
139
-
140
-
141
-
142
-
143
-
144
-
145
-
146
-
147
-
148
-
149
-
150
-
151
-
152
-
153
-
154
-
155
-
156
-
157
-
158
-
159
-
160
-
161
-
162
-
163
-
164
-
165
-
166
-
167
-
168
-
169
-
170
-
171
-
172
-
173
-
174
-
175
-
176
-
177
-
178
-
179
-
180
-
181
-
182
-
183
-
184
-
185
-
186
-
187
-
188
-
189
-
190
-
191
-
192
-
193
-
194
-
195
-
196
-
197
-
198
-
199
-
200
-
201
-
202
-
203
-
204
-
205
-
206
-
207
-
208
-
209
-
210
-
211
-
212
-
213
-
214
-
215
-
216
-
217
-
218
-
219
-
220
-
221
-
222
-
223
-
224
-
225
-
226
-
227
-
228
-
229
-
230
-
231
 |
 |

Table of Contents
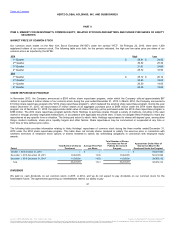
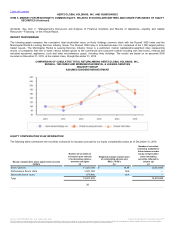
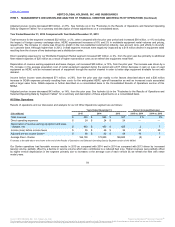
• We recorded $96 million in restructuring and restructuring related expenses during the year ended December 31, 2015 compared to $159
million in 2014, including $38 million in consulting, audit and legal costs associated with the restatement, investigation and remediation
activities in 2015, as compared to $30 million in 2014;
• During 2015, we monetized a portion of our investment in the common stock of CAR Inc., a publicly traded company on the Hong Kong
Stock Exchange, by selling approximately 138 million shares for net proceeds of $236 million which resulted in a pre-tax gain of $133
million. The sale of the shares reduced the Company's ownership interest to 10.2%; and
• During 2015, we repurchased 37 million shares at an aggregate purchase price of approximately $605 million under our $1 billion share
repurchase program compared to no repurchases in 2014.
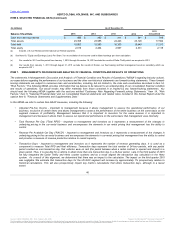
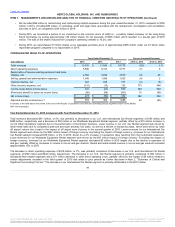
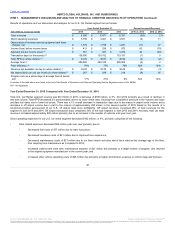
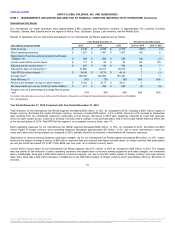
Total revenues $ 10,535
$ 11,046
$ 10,775
(5)%
3 %
Direct operating expenses 5,896
6,314
5,777
(7)
9
Depreciation of revenue earning equipment and lease
charges, net 2,762
3,034
2,533
(9)
20
Selling, general and administrative expenses 1,045
1,088
1,053
(4)
3
Interest expense, net 622
648
707
(4)
(8)
Other (income) expense, net (131)
(15)
102
773
NM
Income (loss) before income taxes 341
(23)
603
NM
NM
(Provision) benefit for taxes on income (loss) (68)
(59)
(301)
15
(80)
Net income (loss) $ 273
$ (82)
$ 302
NM
NM
Adjusted pre-tax income (loss) (a) $ 572
$ 403
$ 1,096
42
(63)
Footnotes to the table above are shown at the end of the Results of Operations and Selected Operating Data by Segment section of this MD&A.
NM - Not meaningful
Total revenues decreased $511 million, or 5%, due primarily to decreases in our U.S. and International Car Rental segments of $185 million and
$288 million, respectively and a decrease of $53 million in our Worldwide Equipment Rental segment, partially offset by a $15 million increase in
our All Other Operations segment due to the performance of the Donlen business. Lower revenue in our U.S. Car Rental segment was driven by
lower rental rates due to competitive pressure and lower ancillary fuel sales, as well as a decline in transaction days, which were driven by lower
off airport volume due in part to the impact of off airport store closures in the second quarter of 2015. Lower revenues for our International Car
Rental segment were driven by the $367 million impact of foreign currency. Excluding the impact of foreign currency, revenues for our International
Car Rental segment increased $79 million, or 4% in 2015, driven by a 2% increase in transaction days resulting from the multi-brand expansion.
Lower revenues for our Worldwide Equipment Rental segment were driven by the $47 million impact of foreign currency. Excluding the impact of
foreign currency, revenues for our Worldwide Equipment Rental segment decreased $6 million in 2015 largely due to the decline in upstream oil
and gas, partially offset by increases in volume in non-oil and gas markets. Rental and rental-related revenue in non-oil and gas markets increased
approximately 10% in 2015.
The decrease in direct operating expenses of $418 million, or 7%, was primarily comprised of decreases in our U.S. and International Car Rental
segments of $162 million and $240 million, respectively. The decrease in our U.S. Car Rental segment is primarily comprised of $84 million in
decreased fleet related expenses and a $71 million decrease in other direct operating costs, partially offset by the impact of $9 million related to
certain adjustments recorded in the third quarter of 2015 that relate to prior periods as further disclosed in Note 2, "Summary of Critical and
Significant Accounting Policies." The decrease in our International Car Rental segment is primarily attributable to the $219 million
44
℠
The information contained herein may not be copied, adapted or distributed and is not warranted to be accurate, complete or timely. The user assumes all risks for any damages or losses arising from any use of this information,
except to the extent such damages or losses cannot be limited or excluded by applicable law. Past financial performance is no guarantee of future results.