Hertz 2015 Annual Report Download - page 126
Download and view the complete annual report
Please find page 126 of the 2015 Hertz annual report below. You can navigate through the pages in the report by either clicking on the pages listed below, or by using the keyword search tool below to find specific information within the annual report.
Table of Contents
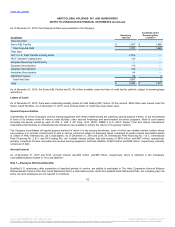
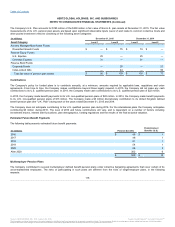
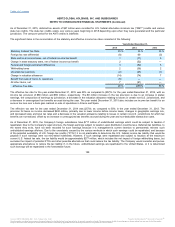
The Company's U.K. Plan accounts for $195 million of the $200 million in fair value of Non-U.S. plan assets at December 31, 2015. The fair value
measurements of its U.K. pension plan assets are based upon significant observable inputs (Level 2) and relate to common collective trusts and
other pooled investment vehicles consisting of the following asset categories:
Actively Managed Multi-Asset Funds:
Diversified Growth Funds $ —
$ 75
$ 74
$ —
Passive Equity Funds:
U.K. Equities 25
—
25
—
Overseas Equities 31
—
31
—
Passive Bond Funds:
Corporate Bonds —
20
—
21
Index-Linked Gilts —
44
—
50
Total fair value of pension plan assets $ 56
$ 139
$ 130
$ 71
The Company's policy for funded plans is to contribute annually, at a minimum, amounts required by applicable laws, regulations and union
agreements. From time to time, the Company makes contributions beyond those legally required. In 2015, the Company did not make any cash
contributions to its U.S. qualified pension plan. In 2014, the Company made cash contributions to its U.S. qualified pension plan of $22 million.
In 2015, the Company made benefit payments to its U.S. non-qualified pension plans of $22 million. In 2014, the Company made benefit payments
to its U.S. non-qualified pension plans of $13 million. The Company made a $3 million discretionary contribution to its United Kingdom defined
benefit pension plan (the "U.K. Plan") during each of the years ended December 31, 2015 and 2014.
The Company does not anticipate contributing to the U.S. qualified pension plan during 2016. For the international plans the Company anticipates
contributing $3 million during 2016. The level of 2016 and future contributions will vary, and is dependent on a number of factors including
investment returns, interest rate fluctuations, plan demographics, funding regulations and the results of the final actuarial valuation.
The following table presents estimated future benefit payments:
2016 $ 48
$ 1
2017 48
1
2018 51
1
2019 54
1
2020 56
2
After 2020 302
6
$ 559
$ 12
The Company contributed to several multiemployer defined benefit pension plans under collective bargaining agreements that cover certain of its
union-represented employees. The risks of participating in such plans are different from the risks of single-employer plans, in the following
respects:
118
℠
The information contained herein may not be copied, adapted or distributed and is not warranted to be accurate, complete or timely. The user assumes all risks for any damages or losses arising from any use of this information,
except to the extent such damages or losses cannot be limited or excluded by applicable law. Past financial performance is no guarantee of future results.


