Hertz 2015 Annual Report Download - page 10
Download and view the complete annual report
Please find page 10 of the 2015 Hertz annual report below. You can navigate through the pages in the report by either clicking on the pages listed below, or by using the keyword search tool below to find specific information within the annual report.-
 1
1 -
 2
2 -
 3
3 -
 4
4 -
 5
5 -
 6
6 -
 7
7 -
 8
8 -
 9
9 -
 10
10 -
 11
11 -
 12
12 -
 13
13 -
 14
14 -
 15
15 -
 16
16 -
 17
17 -
 18
18 -
 19
19 -
 20
20 -
 21
21 -
22
-
23
-
24
-
25
-
26
-
27
-
28
-
29
-
30
-
31
-
32
-
33
-
34
-
35
-
36
-
37
-
38
-
39
-
40
-
41
-
42
-
43
-
44
-
45
-
46
-
47
-
48
-
49
-
50
-
51
-
52
-
53
-
54
-
55
-
56
-
57
-
58
-
59
-
60
-
61
-
62
-
63
-
64
-
65
-
66
-
67
-
68
-
69
-
70
-
71
-
72
-
73
-
74
-
75
-
76
-
77
-
78
-
79
-
80
-
81
-
82
-
83
-
84
-
85
-
86
-
87
-
88
-
89
-
90
-
91
-
92
-
93
-
94
-
95
-
96
-
97
-
98
-
99
-
100
-
101
-
102
-
103
-
104
-
105
-
106
-
107
-
108
-
109
-
110
-
111
-
112
-
113
-
114
-
115
-
116
-
117
-
118
-
119
-
120
-
121
-
122
-
123
-
124
-
125
-
126
-
127
-
128
-
129
-
130
-
131
-
132
-
133
-
134
-
135
-
136
-
137
-
138
-
139
-
140
-
141
-
142
-
143
-
144
-
145
-
146
-
147
-
148
-
149
-
150
-
151
-
152
-
153
-
154
-
155
-
156
-
157
-
158
-
159
-
160
-
161
-
162
-
163
-
164
-
165
-
166
-
167
-
168
-
169
-
170
-
171
-
172
-
173
-
174
-
175
-
176
-
177
-
178
-
179
-
180
-
181
-
182
-
183
-
184
-
185
-
186
-
187
-
188
-
189
-
190
-
191
-
192
-
193
-
194
-
195
-
196
-
197
-
198
-
199
-
200
-
201
-
202
-
203
-
204
-
205
-
206
-
207
-
208
-
209
-
210
-
211
-
212
-
213
-
214
-
215
-
216
-
217
-
218
-
219
-
220
-
221
-
222
-
223
-
224
-
225
-
226
-
227
-
228
-
229
-
230
-
231
 |
 |

Table of Contents
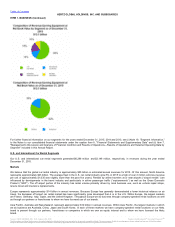
For further financial information on our segments for the years ended December 31, 2015, 2014 and 2013, see (i) Note 19, "Segment Information,"
to the Notes to our consolidated financial statements under the caption Item 8, "Financial Statements and Supplementary Data” and (ii) Item 7,
"Management's Discussion and Analysis of Financial Condition and Results of Operations—Results of Operations and Selected Operating Data by
Segment" included in this Annual Report.
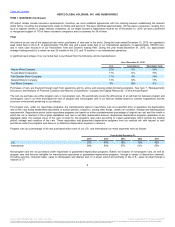
Our U.S. and international car rental segments generated $6,286 million and $2,148 million, respectively, in revenues during the year ended
December 31, 2015.
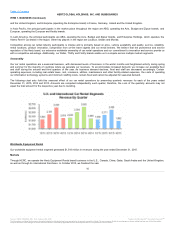
We believe that the global car rental industry is approximately $55 billion in estimated annual revenues for 2015. Of this amount, North America
represents approximately $23 billion. The average fleet in the U.S. car rental industry grew 5% in 2015 to a high of over 2 million vehicles (revenue
per unit of approximately $1,035 was slightly lower than the past five years). Rentals by airline travelers at or near airports (‘‘airport rentals’’) are
influenced by developments in the travel industry and particularly in airline passenger traffic (‘‘enplanements’’) as well as the Gross Domestic
Product (‘‘GDP’’). The off airport portion of the industry has rental volume primarily driven by local business use, such as vehicle repair shops,
leisure travel and insurance replacements.
Europe represents approximately $14 billion in annual revenues. Because Europe has generally demonstrated a lower historical reliance on air
travel, the European off airport car rental market has been significantly more developed than it is in the U.S. Within Europe, the largest markets
are France, Germany, Italy, Spain, and the United Kingdom. Throughout Europe we do business through company-operated rental locations as well
as through our partners or franchisees to whom we have licensed use of our brands.
Asia Pacific, Australia and New Zealand, represent approximately $12 billion in annual revenues. Within Asia Pacific, the largest markets in which
we do business are Australia, China, Japan and South Korea. In each of these markets we have company-operated rental locations or our Hertz
brand is present through our partners, franchisees or companies in which we own an equity interest and to whom we have licensed the Hertz
brand.
℠
The information contained herein may not be copied, adapted or distributed and is not warranted to be accurate, complete or timely. The user assumes all risks for any damages or losses arising from any use of this information,
except to the extent such damages or losses cannot be limited or excluded by applicable law. Past financial performance is no guarantee of future results.