Hertz 2015 Annual Report Download - page 63
Download and view the complete annual report
Please find page 63 of the 2015 Hertz annual report below. You can navigate through the pages in the report by either clicking on the pages listed below, or by using the keyword search tool below to find specific information within the annual report.-
 1
1 -
2
-
3
-
4
-
5
-
6
-
7
-
8
-
9
-
10
-
11
-
12
-
13
-
14
-
15
-
16
-
17
-
18
-
19
-
20
-
21
-
22
-
23
-
24
-
25
-
26
-
27
-
28
-
29
-
30
-
31
-
32
-
33
-
34
-
35
-
36
-
37
-
38
-
39
-
40
-
41
-
42
-
43
-
44
-
45
-
46
-
47
-
48
-
49
-
50
-
51
-
52
-
 53
53 -
 54
54 -
 55
55 -
 56
56 -
 57
57 -
 58
58 -
 59
59 -
 60
60 -
 61
61 -
 62
62 -
 63
63 -
 64
64 -
 65
65 -
 66
66 -
 67
67 -
 68
68 -
 69
69 -
 70
70 -
 71
71 -
 72
72 -
 73
73 -
74
-
75
-
76
-
77
-
78
-
79
-
80
-
81
-
82
-
83
-
84
-
85
-
86
-
87
-
88
-
89
-
90
-
91
-
92
-
93
-
94
-
95
-
96
-
97
-
98
-
99
-
100
-
101
-
102
-
103
-
104
-
105
-
106
-
107
-
108
-
109
-
110
-
111
-
112
-
113
-
114
-
115
-
116
-
117
-
118
-
119
-
120
-
121
-
122
-
123
-
124
-
125
-
126
-
127
-
128
-
129
-
130
-
131
-
132
-
133
-
134
-
135
-
136
-
137
-
138
-
139
-
140
-
141
-
142
-
143
-
144
-
145
-
146
-
147
-
148
-
149
-
150
-
151
-
152
-
153
-
154
-
155
-
156
-
157
-
158
-
159
-
160
-
161
-
162
-
163
-
164
-
165
-
166
-
167
-
168
-
169
-
170
-
171
-
172
-
173
-
174
-
175
-
176
-
177
-
178
-
179
-
180
-
181
-
182
-
183
-
184
-
185
-
186
-
187
-
188
-
189
-
190
-
191
-
192
-
193
-
194
-
195
-
196
-
197
-
198
-
199
-
200
-
201
-
202
-
203
-
204
-
205
-
206
-
207
-
208
-
209
-
210
-
211
-
212
-
213
-
214
-
215
-
216
-
217
-
218
-
219
-
220
-
221
-
222
-
223
-
224
-
225
-
226
-
227
-
228
-
229
-
230
-
231
 |
 |

Table of Contents
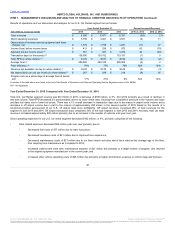
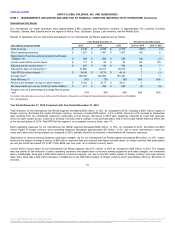
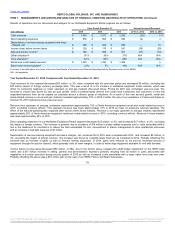
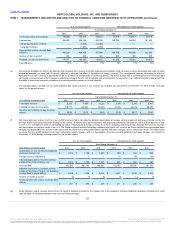
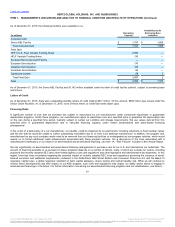
(a) Adjusted pre-tax income (loss) is a Non-GAAP measure that is calculated as income (loss) before income taxes plus certain non-cash acquisition accounting
charges, debt-related charges relating to the amortization and write-off of debt financing costs and debt discounts and certain one-time charges and nonoperational
items. Adjusted pre-tax income (loss) is important to management because it allows management to assess operational performance of our business, exclusive of the
items mentioned above. It also allows management to assess the performance of the entire business on the same basis as the segment measure of profitability.
Management believes that it is important to investors for the same reasons it is important to management and because it allows them to assess our operational
performance on the same basis that management uses internally. When evaluating our operating performance, investors should not consider adjusted pre-tax income
(loss) in isolation of, or as a substitute for, measures of our financial performance, such as net income (loss) or income (loss) before income taxes. The contribution
of our reportable segments to adjusted pre-tax income (loss) and reconciliation to the most comparable consolidated GAAP measure are presented below:
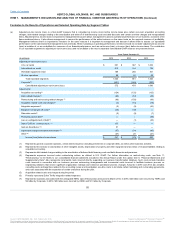
Adjusted pre-tax income (loss):
U.S. car rental $ 551
$ 387
$ 1,033
International car rental 215
144
134
Worldwide equipment rental 189
258
301
All other operations 68
62
58
Total reportable segments 1,023
851
1,526
Corporate(1) (451)
(448)
(430)
Consolidated adjusted pre-tax income (loss) 572
403
1,096
Adjustments:
Acquisition accounting(2) (124)
(132)
(132)
Debt-related charges(3) (63)
(53)
(68)
Restructuring and restructuring related charges (4) (96)
(159)
(99)
Acquisition related costs and charges(5) (3)
(10)
(19)
Integration expenses(6) (5)
(9)
(43)
Equipment rental spin-off costs(7) (35)
(39)
—
Relocation costs(8) (5)
(9)
(7)
Premiums paid on debt(9) —
—
(29)
Loss on extinguishment of debt(10) —
(1)
(35)
Sale of CAR Inc. common stock (11) 133
—
—
Gain on divestitures (12) 51
—
—
Impairment charges and asset write-downs(13) (57)
(34)
(40)
Other(14) (27)
20
(21)
Income (loss) before income taxes $ 341
$ (23)
$ 603
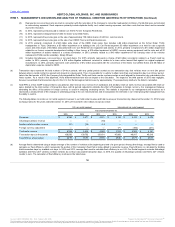
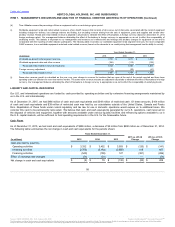
(1) Represents general corporate expenses, certain interest expense (including net interest on corporate debt), as well as other business activities.
(2) Represents the increase in amortization of other intangible assets, depreciation of property and other equipment and accretion of revalued liabilities relating to
acquisition accounting.
(3) Represents debt-related charges relating to the amortization of deferred debt financing costs and debt discounts and premiums.
(4) Represents expenses incurred under restructuring actions as defined in U.S. GAAP. For further information on restructuring costs, see Note 11,
"Restructuring," to the Notes to our consolidated financial statements included in this Annual Report under the caption Item 8, "Financial Statements and
Supplementary Data." Also represents incremental costs incurred directly supporting our business transformation initiatives. Such costs include transition
costs incurred in connection with our business process outsourcing arrangements and incremental costs incurred to facilitate business process re-
engineering initiatives that involve significant organization redesign and extensive operational process changes. Amounts in 2015 and 2014 also includes
consulting costs and legal fees related to the accounting review and investigation, one-time costs to terminate certain marketing and co-branding agreements,
and costs associated with the separation of certain executives during the year.
(5) Acquisition related costs and charges during the period.
(6) Primarily represents Dollar Thrifty integration related expenses.
(7) Represents expenses associated with the anticipated HERC spin-off transaction announced in March 2014. In 2015, $26 million were incurred by HERC and
$9 million by Corporate. In 2014, $28 million were incurred by HERC and $11 million by Corporate.
55
℠
The information contained herein may not be copied, adapted or distributed and is not warranted to be accurate, complete or timely. The user assumes all risks for any damages or losses arising from any use of this information,
except to the extent such damages or losses cannot be limited or excluded by applicable law. Past financial performance is no guarantee of future results.