Hertz 2015 Annual Report Download - page 51
Download and view the complete annual report
Please find page 51 of the 2015 Hertz annual report below. You can navigate through the pages in the report by either clicking on the pages listed below, or by using the keyword search tool below to find specific information within the annual report.
Table of Contents
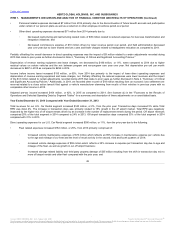
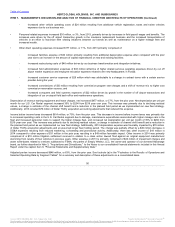
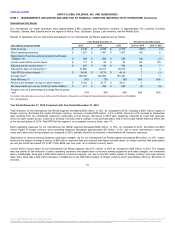
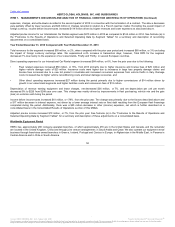
• Total revenue for the U.S. Car Rental segment for the year ended December 31, 2015 decreased by 3%. This decline was driven primarily
by a 1% reduction in transaction days and a 2% reduction in Total RPD, predominantly driven by lower rental rates resulting from
competitive pressure in the industry and lower fuel revenues;
• Net depreciation per unit per month in the U.S. Car Rental segment was down 9% to $267 from $294 for the year ended December 31,
2015 compared to 2014 due to higher residual values on certain vehicles, the mix between program and non-program cars year over year,
and due to the impact on the prior year amount resulting from our reduction in the planned hold period of vehicles as we implemented our
new fleet strategy in the fourth quarter of 2014;
• During 2015, our U.S. Car Rental segment incurred approximately $13 million in pre-tax expenses that relate to prior years comprised of
adjustments of $4 million related to the accounting for the post-acquisition sale of land that was revalued as part of the December 2005
acquisition of the Company, $4 million of additional accruals for the periods 2009 through 2014 resulting from concession audits at certain
airport locations, a $4 million obligation to a jurisdiction for customer transaction fees and $1 million of additional write-offs of assets that
were incorrectly capitalized;
• Completed our previously announced fleet refresh. We sold 46% more non-program cars in our U.S. Car Rental segment for the year
ended December 31, 2015 compared to 2014;
• Completed the integration of Dollar Thrifty, incurring approximately $5 million in integration costs in 2015 as compared to $9 million in
2014;
• Excluding the impact of foreign currency, results in the International Car Rental segment were strong for the year ended December 31,
2015, as compared to 2014, with a 4% increase in revenues, increases in transactions days and Total RPD and a decrease in direct
operating expense of 2%. Net depreciation per unit per month decreased 7% to $211 from $226 year over year, on a constant currency
basis, due to improved fleet procurement and higher residual values on certain vehicles;
• During 2015, following an adverse decision against another industry participant in a similar action, we recorded charges with respect to a
French road tax matter of approximately $23 million;
• Excluding the impact of foreign currency, Worldwide Equipment Rental segment revenues decreased $6 million for the year ended
December 31, 2015, as compared to 2014. Revenue growth was negatively affected by continuing weakness in major upstream oil and
gas markets but was favorably impacted by a 2% increase in worldwide equipment rental volumes. The increase in volume was driven by
new account growth, which is predominantly derived from small local contractors and specialty segments as we diversify our business. As
a result of this new account growth, rental and rental-related revenue in non-oil and gas markets increased approximately 10% in 2015;
• Excluding the impact of foreign currency, direct operating expenses for our Worldwide Equipment Rental segment increased $17 million, or
2%, primarily due to increases in salary related expenses due to costs associated with a rise in the headcount for mechanics to reduce
the fleet unavailable for rent, reinvestment in branch management to drive operational processes and an increase in bad debt expense;
• On October 30, 2015, the Company sold its HERC France and Spain businesses comprised of 60 locations in France and two in Spain
and realized a gain on the sale in the amount of $51 million;
• During 2015, we incurred approximately $35 million in costs associated with the anticipated separation of the Worldwide Equipment Rental
business, as compared to $39 million in 2014;
• We recorded $70 million in impairments and asset write-downs during the year ended December 31, 2015, the largest of which was $40
million related to the HERC trade name;
43
℠
The information contained herein may not be copied, adapted or distributed and is not warranted to be accurate, complete or timely. The user assumes all risks for any damages or losses arising from any use of this information,
except to the extent such damages or losses cannot be limited or excluded by applicable law. Past financial performance is no guarantee of future results.


