Hertz 2015 Annual Report Download - page 47
Download and view the complete annual report
Please find page 47 of the 2015 Hertz annual report below. You can navigate through the pages in the report by either clicking on the pages listed below, or by using the keyword search tool below to find specific information within the annual report.-
 1
1 -
2
-
3
-
4
-
5
-
6
-
7
-
8
-
9
-
10
-
11
-
12
-
13
-
14
-
15
-
16
-
17
-
18
-
19
-
20
-
21
-
22
-
23
-
24
-
25
-
26
-
27
-
28
-
29
-
30
-
31
-
32
-
33
-
34
-
35
-
36
-
 37
37 -
 38
38 -
 39
39 -
 40
40 -
 41
41 -
 42
42 -
 43
43 -
 44
44 -
 45
45 -
 46
46 -
 47
47 -
 48
48 -
 49
49 -
 50
50 -
 51
51 -
 52
52 -
 53
53 -
 54
54 -
 55
55 -
 56
56 -
 57
57 -
58
-
59
-
60
-
61
-
62
-
63
-
64
-
65
-
66
-
67
-
68
-
69
-
70
-
71
-
72
-
73
-
74
-
75
-
76
-
77
-
78
-
79
-
80
-
81
-
82
-
83
-
84
-
85
-
86
-
87
-
88
-
89
-
90
-
91
-
92
-
93
-
94
-
95
-
96
-
97
-
98
-
99
-
100
-
101
-
102
-
103
-
104
-
105
-
106
-
107
-
108
-
109
-
110
-
111
-
112
-
113
-
114
-
115
-
116
-
117
-
118
-
119
-
120
-
121
-
122
-
123
-
124
-
125
-
126
-
127
-
128
-
129
-
130
-
131
-
132
-
133
-
134
-
135
-
136
-
137
-
138
-
139
-
140
-
141
-
142
-
143
-
144
-
145
-
146
-
147
-
148
-
149
-
150
-
151
-
152
-
153
-
154
-
155
-
156
-
157
-
158
-
159
-
160
-
161
-
162
-
163
-
164
-
165
-
166
-
167
-
168
-
169
-
170
-
171
-
172
-
173
-
174
-
175
-
176
-
177
-
178
-
179
-
180
-
181
-
182
-
183
-
184
-
185
-
186
-
187
-
188
-
189
-
190
-
191
-
192
-
193
-
194
-
195
-
196
-
197
-
198
-
199
-
200
-
201
-
202
-
203
-
204
-
205
-
206
-
207
-
208
-
209
-
210
-
211
-
212
-
213
-
214
-
215
-
216
-
217
-
218
-
219
-
220
-
221
-
222
-
223
-
224
-
225
-
226
-
227
-
228
-
229
-
230
-
231
 |
 |

Table of Contents
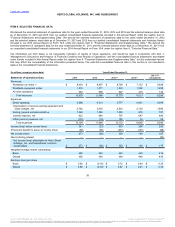
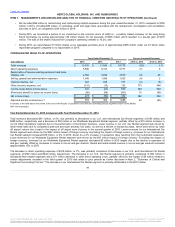
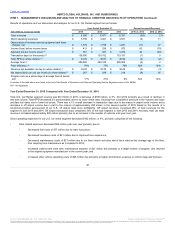
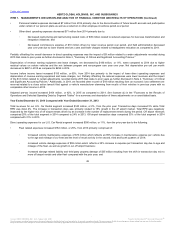
We derived the selected statement of operations data for the years ended December 31, 2015, 2014 and 2013 and the selected balance sheet data
as of December 31, 2015 and 2014 from our audited consolidated financial statements included in this Annual Report under the caption Item 8,
"Financial Statements and Supplementary Data.” We derived the selected statement of operations data for the years ended December 31, 2012
and the selected balance sheet data as of December 31, 2013 and 2012 from our audited consolidated financial statements and footnotes thereto
included in our 2014 Annual Report on Form 10-K under the caption Item 8, "Financial Statements and Supplementary Data." We derived the
selected statement of operations data for the year ended December 31, 2011 and the selected balance sheet data as of December 31, 2011 from
our unaudited consolidated financial statements in our 2014 Annual Report on Form 10-K under the caption Item 6, "Selected Financial Data."
The information set forth below is not necessarily indicative of results of future operations, and should be read in conjunction with Item 7,
“Management’s Discussion and Analysis of Financial Condition and Results of Operations” and the consolidated financial statements and related
notes thereto included in this Annual Report under the caption Item 8, "Financial Statements and Supplementary Data,” to fully understand factors
that may affect the comparability of the information presented below. The selected consolidated financial data in this section is not intended to
replace the consolidated financial statements.
Revenues:
Worldwide car rental (a) $ 8,434
$ 8,907
$ 8,709
$ 7,153
$ 6,938
Worldwide equipment rental 1,518
1,571
1,539
1,382
1,208
All other operations 583
568
527
478
149
Total revenues 10,535
11,046
10,775
9,013
8,295
Expenses:
Direct operating 5,896
6,314
5,777
4,861
4,599
Depreciation of revenue earning equipment and
lease charges, net 2,762
3,034
2,533
2,128
1,896
Selling, general and administrative 1,045
1,088
1,053
978
787
Interest expense, net 622
648
707
647
699
Other (income) expense, net (131)
(15)
102
34
59
Total expenses 10,194
11,069
10,172
8,648
8,040
Income (loss) before income taxes 341
(23) 603
365
255
(Provision) benefit for taxes on income (loss) (68)
(59)
(301)
(181)
(88)
Net income (loss) 273
(82)
302
184
167
Noncontrolling interest —
—
—
—
(20)
Net income (loss) attributable to Hertz Global
Holdings, Inc. and Subsidiaries' common
stockholders $ 273
$ (82)
$ 302
$ 184
$ 147
Weighted average shares outstanding
Basic 452
454
422
420
416
Diluted 456
454
464
448
445
Earnings (loss) per share
Basic $ 0.60
$ (0.18)
$ 0.72
$ 0.44
$ 0.35
Diluted $ 0.60
$ (0.18)
$ 0.67
$ 0.41
$ 0.33
39
℠
The information contained herein may not be copied, adapted or distributed and is not warranted to be accurate, complete or timely. The user assumes all risks for any damages or losses arising from any use of this information,
except to the extent such damages or losses cannot be limited or excluded by applicable law. Past financial performance is no guarantee of future results.