HSBC 2004 Annual Report Download - page 92
Download and view the complete annual report
Please find page 92 of the 2004 HSBC annual report below. You can navigate through the pages in the report by either clicking on the pages listed below, or by using the keyword search tool below to find specific information within the annual report.-
 1
1 -
2
-
3
-
4
-
5
-
6
-
7
-
8
-
9
-
10
-
11
-
12
-
13
-
14
-
15
-
16
-
17
-
18
-
19
-
20
-
21
-
22
-
23
-
24
-
25
-
26
-
27
-
28
-
29
-
30
-
31
-
32
-
33
-
34
-
35
-
36
-
37
-
38
-
39
-
40
-
41
-
42
-
43
-
44
-
45
-
46
-
47
-
48
-
49
-
50
-
51
-
52
-
53
-
54
-
55
-
56
-
57
-
58
-
59
-
60
-
61
-
62
-
63
-
64
-
65
-
66
-
67
-
68
-
69
-
70
-
71
-
72
-
73
-
74
-
75
-
76
-
77
-
78
-
79
-
80
-
81
-
 82
82 -
 83
83 -
 84
84 -
 85
85 -
 86
86 -
 87
87 -
 88
88 -
 89
89 -
 90
90 -
 91
91 -
 92
92 -
 93
93 -
 94
94 -
 95
95 -
 96
96 -
 97
97 -
 98
98 -
 99
99 -
 100
100 -
 101
101 -
 102
102 -
103
-
104
-
105
-
106
-
107
-
108
-
109
-
110
-
111
-
112
-
113
-
114
-
115
-
116
-
117
-
118
-
119
-
120
-
121
-
122
-
123
-
124
-
125
-
126
-
127
-
128
-
129
-
130
-
131
-
132
-
133
-
134
-
135
-
136
-
137
-
138
-
139
-
140
-
141
-
142
-
143
-
144
-
145
-
146
-
147
-
148
-
149
-
150
-
151
-
152
-
153
-
154
-
155
-
156
-
157
-
158
-
159
-
160
-
161
-
162
-
163
-
164
-
165
-
166
-
167
-
168
-
169
-
170
-
171
-
172
-
173
-
174
-
175
-
176
-
177
-
178
-
179
-
180
-
181
-
182
-
183
-
184
-
185
-
186
-
187
-
188
-
189
-
190
-
191
-
192
-
193
-
194
-
195
-
196
-
197
-
198
-
199
-
200
-
201
-
202
-
203
-
204
-
205
-
206
-
207
-
208
-
209
-
210
-
211
-
212
-
213
-
214
-
215
-
216
-
217
-
218
-
219
-
220
-
221
-
222
-
223
-
224
-
225
-
226
-
227
-
228
-
229
-
230
-
231
-
232
-
233
-
234
-
235
-
236
-
237
-
238
-
239
-
240
-
241
-
242
-
243
-
244
-
245
-
246
-
247
-
248
-
249
-
250
-
251
-
252
-
253
-
254
-
255
-
256
-
257
-
258
-
259
-
260
-
261
-
262
-
263
-
264
-
265
-
266
-
267
-
268
-
269
-
270
-
271
-
272
-
273
-
274
-
275
-
276
-
277
-
278
-
279
-
280
-
281
-
282
-
283
-
284
-
285
-
286
-
287
-
288
-
289
-
290
-
291
-
292
-
293
-
294
-
295
-
296
-
297
-
298
-
299
-
300
-
301
-
302
-
303
-
304
-
305
-
306
-
307
-
308
-
309
-
310
-
311
-
312
-
313
-
314
-
315
-
316
-
317
-
318
-
319
-
320
-
321
-
322
-
323
-
324
-
325
-
326
-
327
-
328
-
329
-
330
-
331
-
332
-
333
-
334
-
335
-
336
-
337
-
338
-
339
-
340
-
341
-
342
-
343
-
344
-
345
-
346
-
347
-
348
-
349
-
350
-
351
-
352
-
353
-
354
-
355
-
356
-
357
-
358
-
359
-
360
-
361
-
362
-
363
-
364
-
365
-
366
-
367
-
368
-
369
-
370
-
371
-
372
-
373
-
374
-
375
-
376
-
377
-
378
 |
 |

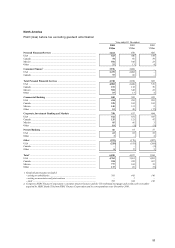
HSBC HOLDINGS PLC
Financial Review (continued)
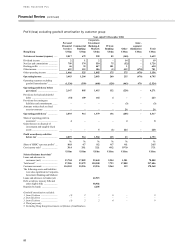
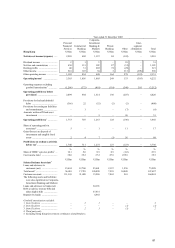
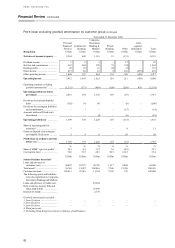
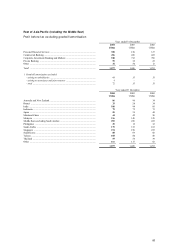
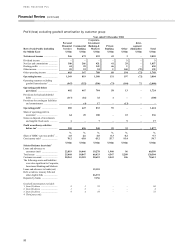
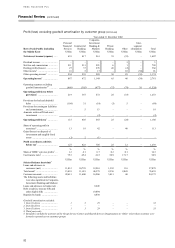
90
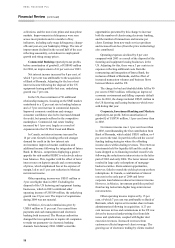
Profit/(loss) excluding goodwill amortisation by customer group
Year ended 31 December 2004
Rest of Asia-Pacific (including
the Middle East)
Personal
Financial
Services
US$m
Commercial
Banking
US$m
Corporate,
Investment
Banking &
Markets
US$m
Private
Banking
US$m
Other
US$m
Inter-
segment
elimination
US$m
Total
US$m
Net interest income ...................... 946 472 592 42 3 – 2,055
Dividend income ............................ ––––3–3
Net fees and commissions .............. 300 266 421 41 29 – 1,057
Dealing profits ............................... 44 59 343 46 2 – 494
Other income ................................. 59 22 24 2 160 (72) 195
Other operating income .................. 403 347 788 89 194 (72) 1,749
Operating income ......................... 1,349 819 1,380 131 197 (72) 3,804
Operating expenses excluding
goodwill amortisation1 ............... (947) (352) (596) (73) (184) 72 (2,080)
Operating profit before
provisions1 ................................ 402 467 784 58 13 – 1,724
Provisions for bad and doubtful
debts .......................................... (117) (16) 32 1 – – (100)
Provisions for contingent liabilities
and commitments ....................... – (4) 17 – (13) – –
Operating profit1 .......................... 285 447 833 59 – – 1,624
Share of operating profit in
associates2 .................................. 64 49 100 – 23 – 236
Gains on disposal of investments
and tangible fixed assets ............ 1–7–9–17
Profit on ordinary activities
before tax3 ................................. 350 496 940 59 32 – 1,877
%%%%% %
Share of HSBC’ s pre-tax profits3 ... 1.8 2.6 4.8 0.3 0.2 9.7
Cost:income ratio1 .......................... 70.2 43.0 43.2 55.7 93.4 54.7
US$m US$m US$m US$m US$m US$m
Selected balance sheet data4
Loans and advances to
customers (net) .......................... 22,819 16,446 19,278 1,960 96 60,599
Total assets .................................... 25,468 18,847 66,433 4,547 5,209 120,504
Customer accounts ......................... 28,961 15,381 28,622 5,543 106 78,613
The following assets and liabilities
were also significant to Corporate,
Investment Banking and Markets:
Loans and advances to banks (net) . 12,118
Debt securities, treasury bills and
other eligible bills ...................... 26,372
Deposits by banks .......................... 7,156
Goodwill amortisation excluded:
1from (1) above ........................... 8159–– 68
2from (2) above ........................... 13––– 4
3from (3) above ........................... 9459–– 72
4Third party only.