HSBC 2004 Annual Report Download - page 284
Download and view the complete annual report
Please find page 284 of the 2004 HSBC annual report below. You can navigate through the pages in the report by either clicking on the pages listed below, or by using the keyword search tool below to find specific information within the annual report.-
 1
1 -
2
-
3
-
4
-
5
-
6
-
7
-
8
-
9
-
10
-
11
-
12
-
13
-
14
-
15
-
16
-
17
-
18
-
19
-
20
-
21
-
22
-
23
-
24
-
25
-
26
-
27
-
28
-
29
-
30
-
31
-
32
-
33
-
34
-
35
-
36
-
37
-
38
-
39
-
40
-
41
-
42
-
43
-
44
-
45
-
46
-
47
-
48
-
49
-
50
-
51
-
52
-
53
-
54
-
55
-
56
-
57
-
58
-
59
-
60
-
61
-
62
-
63
-
64
-
65
-
66
-
67
-
68
-
69
-
70
-
71
-
72
-
73
-
74
-
75
-
76
-
77
-
78
-
79
-
80
-
81
-
82
-
83
-
84
-
85
-
86
-
87
-
88
-
89
-
90
-
91
-
92
-
93
-
94
-
95
-
96
-
97
-
98
-
99
-
100
-
101
-
102
-
103
-
104
-
105
-
106
-
107
-
108
-
109
-
110
-
111
-
112
-
113
-
114
-
115
-
116
-
117
-
118
-
119
-
120
-
121
-
122
-
123
-
124
-
125
-
126
-
127
-
128
-
129
-
130
-
131
-
132
-
133
-
134
-
135
-
136
-
137
-
138
-
139
-
140
-
141
-
142
-
143
-
144
-
145
-
146
-
147
-
148
-
149
-
150
-
151
-
152
-
153
-
154
-
155
-
156
-
157
-
158
-
159
-
160
-
161
-
162
-
163
-
164
-
165
-
166
-
167
-
168
-
169
-
170
-
171
-
172
-
173
-
174
-
175
-
176
-
177
-
178
-
179
-
180
-
181
-
182
-
183
-
184
-
185
-
186
-
187
-
188
-
189
-
190
-
191
-
192
-
193
-
194
-
195
-
196
-
197
-
198
-
199
-
200
-
201
-
202
-
203
-
204
-
205
-
206
-
207
-
208
-
209
-
210
-
211
-
212
-
213
-
214
-
215
-
216
-
217
-
218
-
219
-
220
-
221
-
222
-
223
-
224
-
225
-
226
-
227
-
228
-
229
-
230
-
231
-
232
-
233
-
234
-
235
-
236
-
237
-
238
-
239
-
240
-
241
-
242
-
243
-
244
-
245
-
246
-
247
-
248
-
249
-
250
-
251
-
252
-
253
-
254
-
255
-
256
-
257
-
258
-
259
-
260
-
261
-
262
-
263
-
264
-
265
-
266
-
267
-
268
-
269
-
270
-
271
-
272
-
273
-
 274
274 -
 275
275 -
 276
276 -
 277
277 -
 278
278 -
 279
279 -
 280
280 -
 281
281 -
 282
282 -
 283
283 -
 284
284 -
 285
285 -
 286
286 -
 287
287 -
 288
288 -
 289
289 -
 290
290 -
 291
291 -
 292
292 -
 293
293 -
 294
294 -
295
-
296
-
297
-
298
-
299
-
300
-
301
-
302
-
303
-
304
-
305
-
306
-
307
-
308
-
309
-
310
-
311
-
312
-
313
-
314
-
315
-
316
-
317
-
318
-
319
-
320
-
321
-
322
-
323
-
324
-
325
-
326
-
327
-
328
-
329
-
330
-
331
-
332
-
333
-
334
-
335
-
336
-
337
-
338
-
339
-
340
-
341
-
342
-
343
-
344
-
345
-
346
-
347
-
348
-
349
-
350
-
351
-
352
-
353
-
354
-
355
-
356
-
357
-
358
-
359
-
360
-
361
-
362
-
363
-
364
-
365
-
366
-
367
-
368
-
369
-
370
-
371
-
372
-
373
-
374
-
375
-
376
-
377
-
378
 |
 |

HSBC HOLDINGS PLC
Notes on the Financial Statements (continued)
282
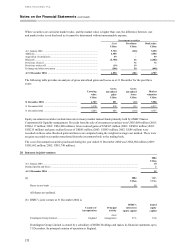
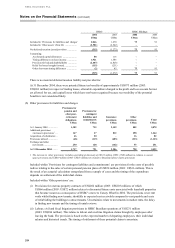
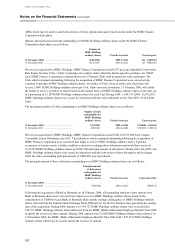
The composition of customer accounts on a geographical basis is set out below:
2004 2003
Interest-
bearing
Non
interest-
bearing Total
Interest-
bearing
Non
interest-
bearing Total
US$m US$m US$m US$m US$m US$m
Europe ................................................. 261,110 31,803 292,913 215,356 27,368 242,724
Hong Kong .......................................... 163,669 14,699 178,368 152,505 11,519 164,024
Rest of Asia-Pacific ............................ 67,861 10,752 78,613 58,651 6,790 65,441
North America .................................... 111,326 21,574 132,900 79,112 14,884 93,996
South America .................................... 9,017 1,940 10,957 5,533 1,412 6,945
612,983 80,768 693,751 511,157 61,973 573,130
The geographical analysis of customer accounts is based on the locations of the offices in which the customer
accounts are recorded.
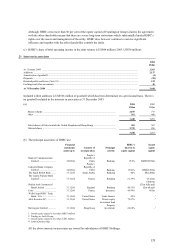
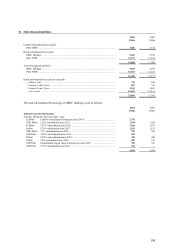
29 Debt securities in issue
2004 2003
US$m US$m
Bonds and medium-term notes, by remaining maturity
– within 1 year ........................................................................................................................... 34,987 29,979
– between 1 and 2 years ............................................................................................................. 25,808 16,950
– between 2 and 5 years ............................................................................................................. 49,985 33,578
– over 5 years ............................................................................................................................. 23,318 30,081
134,098 110,588
Other debt securities in issue, by remaining maturity
– 3 months or less ...................................................................................................................... 54,402 30,115
– 1 year or less but over 3 months ..............................................................................................10,052 3,716
– 5 years or less but over 1 year ................................................................................................. 8,753 8,726
– over 5 years ............................................................................................................................. 1,288 417
208,593 153,562
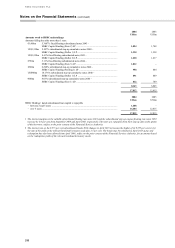
The following table analyses bond and medium-term notes with original maturities greater than one year:
2004 2003
US$m US$m
Fixed rate:
8.875% Adjustable Conversion-Rate Equity Security Units ........................................................... 594 609
8.375% debentures; due 2007 ......................................................................................................... 100 102
Federal Home Loan Bank of New York (‘FHLB’ ) advances – 2.01% to 7.24%; due 2005 to 2033 13 17
3.99% senior debt; due 2044 ........................................................................................................... 557 –
Secured financing:
1.14% to 3.99%; due 2005 to 2008 ............................................................................................. 2,805 3,665
4.00% to 4.99%; due 2005 to 2006 ............................................................................................. 401 445
5.00% to 5.49%; due 2005 to 2007 ............................................................................................. 533 555
5.50% to 5.99%; due 2005 .......................................................................................................... 105 411
7.00% to 7.49%; due 2005 .......................................................................................................... 206 665
7.50% to 7.99%; due 2005 .......................................................................................................... 11 17
8.00% to 8.99%; due 2005 .......................................................................................................... 12 18
Other fixed rate senior debt:
2.15% to 3.99%; due 2005 to 2010 ............................................................................................. 8,378 4,014
4.00% to 4.99%; due 2005 to 2023 ............................................................................................. 11,685 8,373
5.00% to 5.49%; due 2005 to 2023 ............................................................................................. 5,358 5,052
5.50% to 5.99%; due 2005 to 2024 ............................................................................................. 7,495 6,375
6.00% to 6.49%; due 2005 to 2033 ............................................................................................. 9,074 9,834
6.50% to 6.99%; due 2005 to 2033 ............................................................................................. 9,779 9,442
7.00% to 7.49%; due 2005 to 2032 ............................................................................................. 6,876 6,917
7.50% to 7.99%; due 2005 to 2032 ............................................................................................. 8,002 7,968
8.00% to 9.25%; due 2005 to 2012 ............................................................................................. 3,694 3,636
75,678 68,115