HSBC 2004 Annual Report Download - page 366
Download and view the complete annual report
Please find page 366 of the 2004 HSBC annual report below. You can navigate through the pages in the report by either clicking on the pages listed below, or by using the keyword search tool below to find specific information within the annual report.-
 1
1 -
2
-
3
-
4
-
5
-
6
-
7
-
8
-
9
-
10
-
11
-
12
-
13
-
14
-
15
-
16
-
17
-
18
-
19
-
20
-
21
-
22
-
23
-
24
-
25
-
26
-
27
-
28
-
29
-
30
-
31
-
32
-
33
-
34
-
35
-
36
-
37
-
38
-
39
-
40
-
41
-
42
-
43
-
44
-
45
-
46
-
47
-
48
-
49
-
50
-
51
-
52
-
53
-
54
-
55
-
56
-
57
-
58
-
59
-
60
-
61
-
62
-
63
-
64
-
65
-
66
-
67
-
68
-
69
-
70
-
71
-
72
-
73
-
74
-
75
-
76
-
77
-
78
-
79
-
80
-
81
-
82
-
83
-
84
-
85
-
86
-
87
-
88
-
89
-
90
-
91
-
92
-
93
-
94
-
95
-
96
-
97
-
98
-
99
-
100
-
101
-
102
-
103
-
104
-
105
-
106
-
107
-
108
-
109
-
110
-
111
-
112
-
113
-
114
-
115
-
116
-
117
-
118
-
119
-
120
-
121
-
122
-
123
-
124
-
125
-
126
-
127
-
128
-
129
-
130
-
131
-
132
-
133
-
134
-
135
-
136
-
137
-
138
-
139
-
140
-
141
-
142
-
143
-
144
-
145
-
146
-
147
-
148
-
149
-
150
-
151
-
152
-
153
-
154
-
155
-
156
-
157
-
158
-
159
-
160
-
161
-
162
-
163
-
164
-
165
-
166
-
167
-
168
-
169
-
170
-
171
-
172
-
173
-
174
-
175
-
176
-
177
-
178
-
179
-
180
-
181
-
182
-
183
-
184
-
185
-
186
-
187
-
188
-
189
-
190
-
191
-
192
-
193
-
194
-
195
-
196
-
197
-
198
-
199
-
200
-
201
-
202
-
203
-
204
-
205
-
206
-
207
-
208
-
209
-
210
-
211
-
212
-
213
-
214
-
215
-
216
-
217
-
218
-
219
-
220
-
221
-
222
-
223
-
224
-
225
-
226
-
227
-
228
-
229
-
230
-
231
-
232
-
233
-
234
-
235
-
236
-
237
-
238
-
239
-
240
-
241
-
242
-
243
-
244
-
245
-
246
-
247
-
248
-
249
-
250
-
251
-
252
-
253
-
254
-
255
-
256
-
257
-
258
-
259
-
260
-
261
-
262
-
263
-
264
-
265
-
266
-
267
-
268
-
269
-
270
-
271
-
272
-
273
-
274
-
275
-
276
-
277
-
278
-
279
-
280
-
281
-
282
-
283
-
284
-
285
-
286
-
287
-
288
-
289
-
290
-
291
-
292
-
293
-
294
-
295
-
296
-
297
-
298
-
299
-
300
-
301
-
302
-
303
-
304
-
305
-
306
-
307
-
308
-
309
-
310
-
311
-
312
-
313
-
314
-
315
-
316
-
317
-
318
-
319
-
320
-
321
-
322
-
323
-
324
-
325
-
326
-
327
-
328
-
329
-
330
-
331
-
332
-
333
-
334
-
335
-
336
-
337
-
338
-
339
-
340
-
341
-
342
-
343
-
344
-
345
-
346
-
347
-
348
-
349
-
350
-
351
-
352
-
353
-
354
-
355
-
 356
356 -
 357
357 -
 358
358 -
 359
359 -
 360
360 -
 361
361 -
 362
362 -
 363
363 -
 364
364 -
 365
365 -
 366
366 -
 367
367 -
 368
368 -
 369
369 -
 370
370 -
 371
371 -
 372
372 -
 373
373 -
 374
374 -
 375
375 -
 376
376 -
377
-
378
 |
 |

HSBC HOLDINGS PLC
Shareholder Information (continued)
364
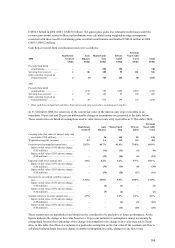
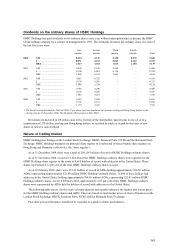
High and low mid-market closing prices
London Hong Kong New York Paris2Bermuda3
US$0.50 shares US$0.50 shares ADSs1US$0.50 shares US$0.50 shares
High Low High Low High Low High Low High Low
pence pence HK$ HK$ US$ US$ euro euro US$ US$
2004 ......................... 954 784 136.5 109.5 87.8 70.0 13.6 11.8 17.3 14.5
2003 ….. ................... 914 631 122.5 80.3 78.8 51.1 13.4 9.3 – –
2002 ......................... 866 643 97.5 78.8 64.4 50.3 13.9 10.2 – –
2001 ......................... 1092 608 121.5 68.5 79.7 44.8 17.3 9.5 – –
2000 ......................... 1046 682 117.5 82.8 76.6 54.3 17.6 14.2 – –
London Hong Kong New York Paris Bermuda
US$0.50 shares US$0.50 shares ADSs US$0.50 shares US$0.50 shares
High Low High Low High Low High Low High Low
pence pence HK$ HK$ US$ US$ euro euro US$ US$
2004
4th Quarter .............. 954 860 136.5 124.5 87.8 79.8 13.6 12.4 17.3 16.0
3rd Quarter .............. 888 784 124.0 114.5 79.8 72.7 13.1 11.8 15.9 14.6
2nd Quarter ............. 836 789 118.5 109.5 76.5 70.0 12.6 11.8 15.3 14.5
1st Quarter .............. 893 802 128.5 115.5 82.5 73.5 13.2 12.0 16.5 14.7
2003
4th Quarter ................ 914 810 122.5 104.0 78.8 68.0 13.4 11.5 – –
3rd Quarter ................ 828 700 105.0 91.8 67.3 58.6 12.0 10.1 – –
2nd Quarter ................ 743 650 97.0 80.3 62.5 51.6 10.7 9.4 – –
1st Quarter ................. 709 631 89.0 80.3 57.3 51.1 10.9 9.3 – –
London Hong Kong New York Paris Bermuda
US$0.50 shares US$0.50 shares ADSs US$0.50 shares US$0.50 shares
High Low High Low High Low High Low High Low
pence pence HK$ HK$ US$ US$ euro euro US$ US$
2005
January ..................... 900 868 132.5 127.0 84.7 81.3 12.7 12.4 16.5 16.5
2004
December ................. 895 860 134.5 130.0 86.7 83.6 13.0 12.4 17.1 16.7
November ................. 954 891 136.5 126.5 87.8 81.8 13.6 12.8 17.3 16.6
October .................... 909 873 126.0 124.5 81.0 79.8 13.1 12.6 16.3 16.0
September ................ 888 871 124.0 122.0 79.8 78.3 13.1 12.8 15.9 15.6
August ...................... 866 821 121.5 115.0 77.9 75.3 13.0 12.2 15.3 15.0
July ........................... 814 784 117.5 114.5 74.4 72.7 12.3 11.8 15.2 14.6
Notes
1 In New York each ADS represents 5 underlying ordinary shares.
2 Shares were not listed on the Paris Bourse (now Euronext Paris) prior to 28 July 2000.
3 Shares were not listed on the Bermuda Stock Exchange prior to 18 February 2004.