HSBC 2004 Annual Report Download - page 43
Download and view the complete annual report
Please find page 43 of the 2004 HSBC annual report below. You can navigate through the pages in the report by either clicking on the pages listed below, or by using the keyword search tool below to find specific information within the annual report.-
 1
1 -
2
-
3
-
4
-
5
-
6
-
7
-
8
-
9
-
10
-
11
-
12
-
13
-
14
-
15
-
16
-
17
-
18
-
19
-
20
-
21
-
22
-
23
-
24
-
25
-
26
-
27
-
28
-
29
-
30
-
31
-
32
-
 33
33 -
 34
34 -
 35
35 -
 36
36 -
 37
37 -
 38
38 -
 39
39 -
 40
40 -
 41
41 -
 42
42 -
 43
43 -
 44
44 -
 45
45 -
 46
46 -
 47
47 -
 48
48 -
 49
49 -
 50
50 -
 51
51 -
 52
52 -
 53
53 -
54
-
55
-
56
-
57
-
58
-
59
-
60
-
61
-
62
-
63
-
64
-
65
-
66
-
67
-
68
-
69
-
70
-
71
-
72
-
73
-
74
-
75
-
76
-
77
-
78
-
79
-
80
-
81
-
82
-
83
-
84
-
85
-
86
-
87
-
88
-
89
-
90
-
91
-
92
-
93
-
94
-
95
-
96
-
97
-
98
-
99
-
100
-
101
-
102
-
103
-
104
-
105
-
106
-
107
-
108
-
109
-
110
-
111
-
112
-
113
-
114
-
115
-
116
-
117
-
118
-
119
-
120
-
121
-
122
-
123
-
124
-
125
-
126
-
127
-
128
-
129
-
130
-
131
-
132
-
133
-
134
-
135
-
136
-
137
-
138
-
139
-
140
-
141
-
142
-
143
-
144
-
145
-
146
-
147
-
148
-
149
-
150
-
151
-
152
-
153
-
154
-
155
-
156
-
157
-
158
-
159
-
160
-
161
-
162
-
163
-
164
-
165
-
166
-
167
-
168
-
169
-
170
-
171
-
172
-
173
-
174
-
175
-
176
-
177
-
178
-
179
-
180
-
181
-
182
-
183
-
184
-
185
-
186
-
187
-
188
-
189
-
190
-
191
-
192
-
193
-
194
-
195
-
196
-
197
-
198
-
199
-
200
-
201
-
202
-
203
-
204
-
205
-
206
-
207
-
208
-
209
-
210
-
211
-
212
-
213
-
214
-
215
-
216
-
217
-
218
-
219
-
220
-
221
-
222
-
223
-
224
-
225
-
226
-
227
-
228
-
229
-
230
-
231
-
232
-
233
-
234
-
235
-
236
-
237
-
238
-
239
-
240
-
241
-
242
-
243
-
244
-
245
-
246
-
247
-
248
-
249
-
250
-
251
-
252
-
253
-
254
-
255
-
256
-
257
-
258
-
259
-
260
-
261
-
262
-
263
-
264
-
265
-
266
-
267
-
268
-
269
-
270
-
271
-
272
-
273
-
274
-
275
-
276
-
277
-
278
-
279
-
280
-
281
-
282
-
283
-
284
-
285
-
286
-
287
-
288
-
289
-
290
-
291
-
292
-
293
-
294
-
295
-
296
-
297
-
298
-
299
-
300
-
301
-
302
-
303
-
304
-
305
-
306
-
307
-
308
-
309
-
310
-
311
-
312
-
313
-
314
-
315
-
316
-
317
-
318
-
319
-
320
-
321
-
322
-
323
-
324
-
325
-
326
-
327
-
328
-
329
-
330
-
331
-
332
-
333
-
334
-
335
-
336
-
337
-
338
-
339
-
340
-
341
-
342
-
343
-
344
-
345
-
346
-
347
-
348
-
349
-
350
-
351
-
352
-
353
-
354
-
355
-
356
-
357
-
358
-
359
-
360
-
361
-
362
-
363
-
364
-
365
-
366
-
367
-
368
-
369
-
370
-
371
-
372
-
373
-
374
-
375
-
376
-
377
-
378
 |
 |

41
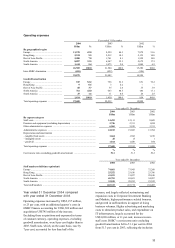
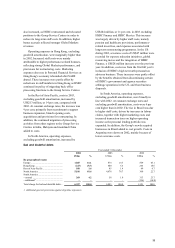
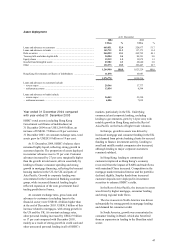
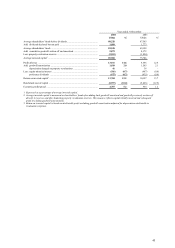
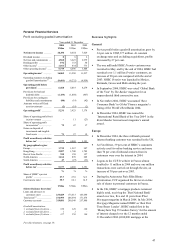
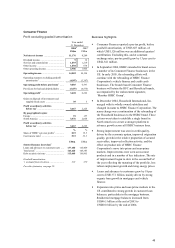
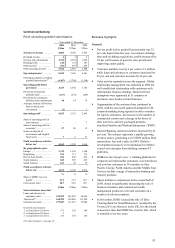
Asset deployment
At 31 December
2004 2003
US$m % US$m %
Loans and advances to customers ............................................................... 669,831 52.9 528,977 51.7
Loans and advances to banks ...................................................................... 142,712 11.3 117,173 11.4
Debt securities ............................................................................................ 240,999 19.1 205,722 20.1
Treasury bills and other eligible bills .......................................................... 30,284 2.4 20,391 2.0
Equity shares ............................................................................................... 19,319 1.5 12,879 1.3
Goodwill and intangible assets .................................................................... 29,382 2.3 28,640 2.8
Other ........................................................................................................... 132,373 10.5 109,447 10.7
1,264,900 100.0 1,023,229 100.0
Hong Kong Government certificates of indebtedness ................................. 11,878 10,987
1,276,778 1,034,216
Loans and advances to customers include:
– reverse repos ........................................................................................... 29,346 17,777
– settlement accounts ................................................................................. 13,834 8,594
Loans and advances to banks include:
– reverse repos ........................................................................................... 36,543 23,220
– settlement accounts ................................................................................. 6,086 7,039
Year ended 31 December 2004 compared
with year ended 31 December 2003
HSBC’ s total assets (excluding Hong Kong
Government certificates of indebtedness) at
31 December 2004 were US$1,264.9 billion, an
increase of US$241.7 billion or 24 per cent since
31 December 2003. At constant exchange rates, total
assets grew by US$203.8 billion or 19 per cent.
At 31 December 2004, HSBC’ s balance sheet
remained highly liquid, reflecting strong growth in
customer deposits. The proportion of assets deployed
in customer advances rose to 53 per cent. Customer
advances increased by 27 per cent, marginally higher
than the growth in total assets, driven essentially by
lending to finance consumer spending and strong
growth in mortgage financing, reflecting the buoyant
housing markets in the US, the UK and parts of
Asia-Pacific. Growth in corporate lending was
concentrated in the Commercial Banking customer
group, while increased financial lending largely
reflected expansion of the euro government bond
trading portfolios in France.
At constant exchange rates, gross loans and
advances to customers (excluding loans to the
financial sector) were US$101.4 billion higher than
at the end of December 2003. US$50.5 billion of this
increase related to mortgages, with strong growth in
the US and the UK. At constant exchange rates,
other personal lending increased by US$22.9 billion
or 17 per cent compared with December 2003,
mainly as a result of strong growth in credit card and
other unsecured personal lending in all of HSBC’ s
markets, particularly in the UK. Underlying
commercial and corporate lending, excluding
lending to governments, grew by 14 per cent, with
notable growth in Hong Kong and in the Rest of
Asia-Pacific on the back of higher trade volumes.
In Europe, growth in assets was driven by
increased mortgage and consumer lending in the UK
and demand from private banking clients for secured
funding to finance investment activity. Lending to
small and middle market companies also increased,
although lending to major corporate customers
remained subdued.
In Hong Kong, lending to commercial
customers improved as Hong Kong’ s economy
recovered from the impact of SARS and trade flows
with mainland China increased. Competition in the
mortgage market remained intense and the portfolio
declined slightly. Surplus funds from increased
customer deposits were deployed in investment
securities to enhance HSBC’ s yields.
In the Rest of Asia-Pacific, the increase in assets
was driven by higher mortgage, consumer lending
and strong regional trade flows.
The rise in assets in North America was driven
substantially by strong growth in mortgage lending
and demand for consumer credit.
In South America, growth was concentrated in
consumer lending in Brazil, which also benefited
from an expansion in lending to the Brazilian retail
sector.