HSBC 2004 Annual Report Download - page 63
Download and view the complete annual report
Please find page 63 of the 2004 HSBC annual report below. You can navigate through the pages in the report by either clicking on the pages listed below, or by using the keyword search tool below to find specific information within the annual report.-
 1
1 -
2
-
3
-
4
-
5
-
6
-
7
-
8
-
9
-
10
-
11
-
12
-
13
-
14
-
15
-
16
-
17
-
18
-
19
-
20
-
21
-
22
-
23
-
24
-
25
-
26
-
27
-
28
-
29
-
30
-
31
-
32
-
33
-
34
-
35
-
36
-
37
-
38
-
39
-
40
-
41
-
42
-
43
-
44
-
45
-
46
-
47
-
48
-
49
-
50
-
51
-
52
-
 53
53 -
 54
54 -
 55
55 -
 56
56 -
 57
57 -
 58
58 -
 59
59 -
 60
60 -
 61
61 -
 62
62 -
 63
63 -
 64
64 -
 65
65 -
 66
66 -
 67
67 -
 68
68 -
 69
69 -
 70
70 -
 71
71 -
 72
72 -
 73
73 -
74
-
75
-
76
-
77
-
78
-
79
-
80
-
81
-
82
-
83
-
84
-
85
-
86
-
87
-
88
-
89
-
90
-
91
-
92
-
93
-
94
-
95
-
96
-
97
-
98
-
99
-
100
-
101
-
102
-
103
-
104
-
105
-
106
-
107
-
108
-
109
-
110
-
111
-
112
-
113
-
114
-
115
-
116
-
117
-
118
-
119
-
120
-
121
-
122
-
123
-
124
-
125
-
126
-
127
-
128
-
129
-
130
-
131
-
132
-
133
-
134
-
135
-
136
-
137
-
138
-
139
-
140
-
141
-
142
-
143
-
144
-
145
-
146
-
147
-
148
-
149
-
150
-
151
-
152
-
153
-
154
-
155
-
156
-
157
-
158
-
159
-
160
-
161
-
162
-
163
-
164
-
165
-
166
-
167
-
168
-
169
-
170
-
171
-
172
-
173
-
174
-
175
-
176
-
177
-
178
-
179
-
180
-
181
-
182
-
183
-
184
-
185
-
186
-
187
-
188
-
189
-
190
-
191
-
192
-
193
-
194
-
195
-
196
-
197
-
198
-
199
-
200
-
201
-
202
-
203
-
204
-
205
-
206
-
207
-
208
-
209
-
210
-
211
-
212
-
213
-
214
-
215
-
216
-
217
-
218
-
219
-
220
-
221
-
222
-
223
-
224
-
225
-
226
-
227
-
228
-
229
-
230
-
231
-
232
-
233
-
234
-
235
-
236
-
237
-
238
-
239
-
240
-
241
-
242
-
243
-
244
-
245
-
246
-
247
-
248
-
249
-
250
-
251
-
252
-
253
-
254
-
255
-
256
-
257
-
258
-
259
-
260
-
261
-
262
-
263
-
264
-
265
-
266
-
267
-
268
-
269
-
270
-
271
-
272
-
273
-
274
-
275
-
276
-
277
-
278
-
279
-
280
-
281
-
282
-
283
-
284
-
285
-
286
-
287
-
288
-
289
-
290
-
291
-
292
-
293
-
294
-
295
-
296
-
297
-
298
-
299
-
300
-
301
-
302
-
303
-
304
-
305
-
306
-
307
-
308
-
309
-
310
-
311
-
312
-
313
-
314
-
315
-
316
-
317
-
318
-
319
-
320
-
321
-
322
-
323
-
324
-
325
-
326
-
327
-
328
-
329
-
330
-
331
-
332
-
333
-
334
-
335
-
336
-
337
-
338
-
339
-
340
-
341
-
342
-
343
-
344
-
345
-
346
-
347
-
348
-
349
-
350
-
351
-
352
-
353
-
354
-
355
-
356
-
357
-
358
-
359
-
360
-
361
-
362
-
363
-
364
-
365
-
366
-
367
-
368
-
369
-
370
-
371
-
372
-
373
-
374
-
375
-
376
-
377
-
378
 |
 |

61
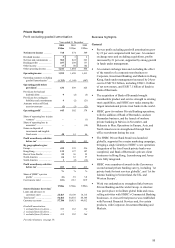
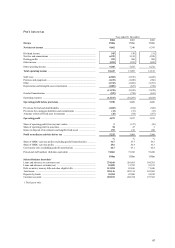
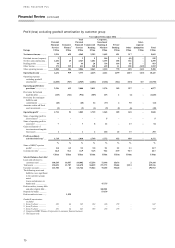
Profit before tax
Year ended 31 December
2004 2003 2002
Europe US$m US$m US$m
Net interest income ...................................................................................... 9,062 7,540 6,343
Dividend income ............................................................................................ 545 150 211
Net fees and commissions .............................................................................. 6,295 5,192 4,528
Dealing profits ............................................................................................... 953 960 508
Other income ................................................................................................. 1,592 1,253 1,025
Other operating income .................................................................................. 9,385 7,555 6,272
Total operating income ................................................................................ 18,447 15,095 12,615
Staff costs ...................................................................................................... (6,583) (5,576) (4,425)
Premises and equipment ................................................................................. (1,235) (1,058) (966)
Other .............................................................................................................. (2,743) (2,068) (1,763)
Depreciation and intangible asset amortisation .............................................. (1,009) (827) (724)
(11,570) (9,529) (7,878)
Goodwill amortisation ................................................................................... (947) (758) (651)
Operating expenses ........................................................................................ (12,517) (10,287) (8,529)
Operating profit before provisions ............................................................. 5,930 4,808 4,086
Provisions for bad and doubtful debts ............................................................ (1,025) (874) (569)
Provisions for contingent liabilities and commitments ................................... (12) (33) (15)
Amounts written off fixed asset investments ................................................. (20) (64) (267)
Operating profit ........................................................................................... 4,873 3,837 3,235
Share of operating profit/(loss) in joint venture ............................................. 5(127) (26)
Share of operating profit in associates ............................................................ 54 47 3
Gains on disposal of investments and tangible fixed assets ............................ 293 212 288
Profit on ordinary activities before tax ...................................................... 5,225 3,969 3,500
%%%
Share of HSBC’ s pre-tax profits (excluding goodwill amortisation) .............. 31.7 33.7 39.5
Share of HSBC’ s pre-tax profits .................................................................... 29.6 30.9 36.3
Cost:income ratio (excluding goodwill amortisation) .................................... 62.7 63.1 62.4
Period-end staff numbers (full-time equivalent) ............................................. 74,861 73,943 72,260
US$m US$m US$m
Selected balance sheet data1
Loans and advances to customers (net) .......................................................... 274,160 210,605 164,701
Loans and advances to banks (net) ................................................................. 55,859 51,783 39,373
Debt securities, treasury bills and other eligible bills ..................................... 112,894 82,656 71,446
Total assets .................................................................................................... 539,116 425,312 341,569
Deposits by banks .......................................................................................... 55,204 47,500 34,559
Customer accounts ......................................................................................... 292,913 242,724 197,362
1 Third party only.