HSBC 2004 Annual Report Download - page 318
Download and view the complete annual report
Please find page 318 of the 2004 HSBC annual report below. You can navigate through the pages in the report by either clicking on the pages listed below, or by using the keyword search tool below to find specific information within the annual report.-
 1
1 -
2
-
3
-
4
-
5
-
6
-
7
-
8
-
9
-
10
-
11
-
12
-
13
-
14
-
15
-
16
-
17
-
18
-
19
-
20
-
21
-
22
-
23
-
24
-
25
-
26
-
27
-
28
-
29
-
30
-
31
-
32
-
33
-
34
-
35
-
36
-
37
-
38
-
39
-
40
-
41
-
42
-
43
-
44
-
45
-
46
-
47
-
48
-
49
-
50
-
51
-
52
-
53
-
54
-
55
-
56
-
57
-
58
-
59
-
60
-
61
-
62
-
63
-
64
-
65
-
66
-
67
-
68
-
69
-
70
-
71
-
72
-
73
-
74
-
75
-
76
-
77
-
78
-
79
-
80
-
81
-
82
-
83
-
84
-
85
-
86
-
87
-
88
-
89
-
90
-
91
-
92
-
93
-
94
-
95
-
96
-
97
-
98
-
99
-
100
-
101
-
102
-
103
-
104
-
105
-
106
-
107
-
108
-
109
-
110
-
111
-
112
-
113
-
114
-
115
-
116
-
117
-
118
-
119
-
120
-
121
-
122
-
123
-
124
-
125
-
126
-
127
-
128
-
129
-
130
-
131
-
132
-
133
-
134
-
135
-
136
-
137
-
138
-
139
-
140
-
141
-
142
-
143
-
144
-
145
-
146
-
147
-
148
-
149
-
150
-
151
-
152
-
153
-
154
-
155
-
156
-
157
-
158
-
159
-
160
-
161
-
162
-
163
-
164
-
165
-
166
-
167
-
168
-
169
-
170
-
171
-
172
-
173
-
174
-
175
-
176
-
177
-
178
-
179
-
180
-
181
-
182
-
183
-
184
-
185
-
186
-
187
-
188
-
189
-
190
-
191
-
192
-
193
-
194
-
195
-
196
-
197
-
198
-
199
-
200
-
201
-
202
-
203
-
204
-
205
-
206
-
207
-
208
-
209
-
210
-
211
-
212
-
213
-
214
-
215
-
216
-
217
-
218
-
219
-
220
-
221
-
222
-
223
-
224
-
225
-
226
-
227
-
228
-
229
-
230
-
231
-
232
-
233
-
234
-
235
-
236
-
237
-
238
-
239
-
240
-
241
-
242
-
243
-
244
-
245
-
246
-
247
-
248
-
249
-
250
-
251
-
252
-
253
-
254
-
255
-
256
-
257
-
258
-
259
-
260
-
261
-
262
-
263
-
264
-
265
-
266
-
267
-
268
-
269
-
270
-
271
-
272
-
273
-
274
-
275
-
276
-
277
-
278
-
279
-
280
-
281
-
282
-
283
-
284
-
285
-
286
-
287
-
288
-
289
-
290
-
291
-
292
-
293
-
294
-
295
-
296
-
297
-
298
-
299
-
300
-
301
-
302
-
303
-
304
-
305
-
306
-
307
-
 308
308 -
 309
309 -
 310
310 -
 311
311 -
 312
312 -
 313
313 -
 314
314 -
 315
315 -
 316
316 -
 317
317 -
 318
318 -
 319
319 -
 320
320 -
 321
321 -
 322
322 -
 323
323 -
 324
324 -
 325
325 -
 326
326 -
 327
327 -
 328
328 -
329
-
330
-
331
-
332
-
333
-
334
-
335
-
336
-
337
-
338
-
339
-
340
-
341
-
342
-
343
-
344
-
345
-
346
-
347
-
348
-
349
-
350
-
351
-
352
-
353
-
354
-
355
-
356
-
357
-
358
-
359
-
360
-
361
-
362
-
363
-
364
-
365
-
366
-
367
-
368
-
369
-
370
-
371
-
372
-
373
-
374
-
375
-
376
-
377
-
378
 |
 |

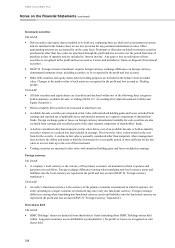
HSBC HOLDINGS PLC
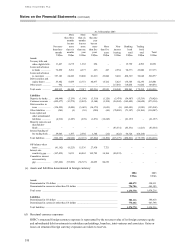
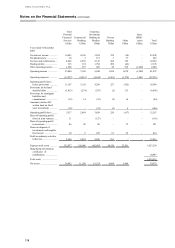
Notes on the Financial Statements (continued)
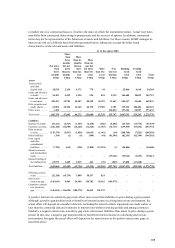
316
Hong
Rest of
Asia- North South
Intra-
HSBC
Europe Kong Pacific America America items Total
US$m US$m US$m US$m US$m US$m US$m
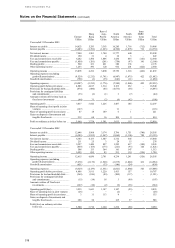
Year ended 31 December 2003
Interest receivable ................................... 14,023 5,293 3,363 16,285 1,716 (712) 39,968
Interest payable ....................................... (6,483) (1,392) (1,623) (4,508) (1,076) 712 (14,370)
Net interest income ................................. 7,540 3,901 1,740 11,777 640 – 25,598
Dividend income ..................................... 150 31 4 34 3 – 222
Fees and commissions receivable ........... 6,242 1,584 1,006 3,434 435 (141) 12,560
Fees and commissions payable ............... (1,050) (201) (201) (758) (97) 141 (2,166)
Dealing profits ........................................ 960 321 421 340 136 – 2,178
Other operating income ........................... 1,253 596 120 932 201 (422) 2,680
Operating income .................................... 15,095 6,232 3,090 15,759 1,318 (422) 41,072
Operating expenses (excluding
goodwill amortisation) ........................ (9,529) (2,212) (1,741) (6,947) (1,075) 422 (21,082)
Goodwill amortisation ............................ (758) (3) (35) (643) (11) – (1,450)
Operating expenses ................................. (10,287) (2,215) (1,776) (7,590) (1,086) 422 (22,532)
Operating profit before provisions .......... 4,808 4,017 1,314 8,169 232 – 18,540
Provisions for bad and doubtful debts ..... (874) (400) (85) (4,676) (58) – (6,093)
Provisions for contingent liabilities
and commitments ................................ (33) (6) (1) 3 (7) – (44)
Amounts (written off)/written back on
fixed asset investments ....................... (64) 31 (2) (9) (62) – (106)
Operating profit ...................................... 3,837 3,642 1,226 3,487 105 – 12,297
Share of operating (loss)/profit in joint
ventures .............................................. (127) – – 11 – – (116)
Share of operating profit in associates .... 47 18 149 6 1 – 221
Gains on disposal of investments and
tangible fixed assets ............................ 2126816109 9 –414
Profit on ordinary activities before tax .... 3,969 3,728 1,391 3,613 115 – 12,816
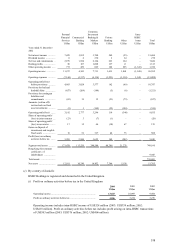
Year ended 31 December 2002
Interest receivable.................................... 12,646 5,968 3,174 5,796 1,751 (740) 28,595
Interest payable........................................ (6,303) (1,835) (1,567) (3,064) (1,106) 740 (13,135)
Net interest income .................................. 6,343 4,133 1,607 2,732 645 – 15,460
Dividend income...................................... 211 25 3 24 15 – 278
Fees and commissions receivable ............ 5,397 1,449 897 1,205 417 (120) 9,245
Fees and commissions payable ................ (869) (185) (173) (221) (93) 120 (1,421)
Dealing profits ......................................... 508 133 364 161 147 – 1,313
Other operating income............................ 1,025 495 83 333 110 (326) 1,720
Operating income..................................... 12,615 6,050 2,781 4,234 1,241 (326) 26,595
Operating expenses (excluding
goodwill amortisation)......................... (7,878) (2,139) (1,528) (2,675) (1,060) 326 (14,954)
Goodwill amortisation ............................ (651) – (33) (146) (24) – (854)
Operating expenses ................................. (8,529) (2,139) (1,561) (2,821) (1,084) 326 (15,808)
Operating profit before provisions ........... 4,086 3,911 1,220 1,413 157 – 10,787
Provisions for bad and doubtful debts...... (569) (246) (89) (300) (117) – (1,321)
Provisions for contingent liabilities
and commitments................................. (15) (14) 18 3 (99) – (107)
Amounts written off fixed asset
investments.......................................... (267) (10) (2) (9) (36) – (324)
Operating profit/(loss).............................. 3,235 3,641 1,147 1,107 (95) – 9,035
Share of operating loss in joint ventures . (26) – – (2) – – (28)
Share of operating profit in associates ..... 3 11 113 8 – – 135
Gains on disposal of investments and
tangible fixed assets............................. 288 58 – 125 37 – 508
Profit/(loss) on ordinary activities
before tax............................................. 3,500 3,710 1,260 1,238 (58) – 9,650