HSBC 2004 Annual Report Download - page 256
Download and view the complete annual report
Please find page 256 of the 2004 HSBC annual report below. You can navigate through the pages in the report by either clicking on the pages listed below, or by using the keyword search tool below to find specific information within the annual report.-
 1
1 -
2
-
3
-
4
-
5
-
6
-
7
-
8
-
9
-
10
-
11
-
12
-
13
-
14
-
15
-
16
-
17
-
18
-
19
-
20
-
21
-
22
-
23
-
24
-
25
-
26
-
27
-
28
-
29
-
30
-
31
-
32
-
33
-
34
-
35
-
36
-
37
-
38
-
39
-
40
-
41
-
42
-
43
-
44
-
45
-
46
-
47
-
48
-
49
-
50
-
51
-
52
-
53
-
54
-
55
-
56
-
57
-
58
-
59
-
60
-
61
-
62
-
63
-
64
-
65
-
66
-
67
-
68
-
69
-
70
-
71
-
72
-
73
-
74
-
75
-
76
-
77
-
78
-
79
-
80
-
81
-
82
-
83
-
84
-
85
-
86
-
87
-
88
-
89
-
90
-
91
-
92
-
93
-
94
-
95
-
96
-
97
-
98
-
99
-
100
-
101
-
102
-
103
-
104
-
105
-
106
-
107
-
108
-
109
-
110
-
111
-
112
-
113
-
114
-
115
-
116
-
117
-
118
-
119
-
120
-
121
-
122
-
123
-
124
-
125
-
126
-
127
-
128
-
129
-
130
-
131
-
132
-
133
-
134
-
135
-
136
-
137
-
138
-
139
-
140
-
141
-
142
-
143
-
144
-
145
-
146
-
147
-
148
-
149
-
150
-
151
-
152
-
153
-
154
-
155
-
156
-
157
-
158
-
159
-
160
-
161
-
162
-
163
-
164
-
165
-
166
-
167
-
168
-
169
-
170
-
171
-
172
-
173
-
174
-
175
-
176
-
177
-
178
-
179
-
180
-
181
-
182
-
183
-
184
-
185
-
186
-
187
-
188
-
189
-
190
-
191
-
192
-
193
-
194
-
195
-
196
-
197
-
198
-
199
-
200
-
201
-
202
-
203
-
204
-
205
-
206
-
207
-
208
-
209
-
210
-
211
-
212
-
213
-
214
-
215
-
216
-
217
-
218
-
219
-
220
-
221
-
222
-
223
-
224
-
225
-
226
-
227
-
228
-
229
-
230
-
231
-
232
-
233
-
234
-
235
-
236
-
237
-
238
-
239
-
240
-
241
-
242
-
243
-
244
-
245
-
 246
246 -
 247
247 -
 248
248 -
 249
249 -
 250
250 -
 251
251 -
 252
252 -
 253
253 -
 254
254 -
 255
255 -
 256
256 -
 257
257 -
 258
258 -
 259
259 -
 260
260 -
 261
261 -
 262
262 -
 263
263 -
 264
264 -
 265
265 -
 266
266 -
267
-
268
-
269
-
270
-
271
-
272
-
273
-
274
-
275
-
276
-
277
-
278
-
279
-
280
-
281
-
282
-
283
-
284
-
285
-
286
-
287
-
288
-
289
-
290
-
291
-
292
-
293
-
294
-
295
-
296
-
297
-
298
-
299
-
300
-
301
-
302
-
303
-
304
-
305
-
306
-
307
-
308
-
309
-
310
-
311
-
312
-
313
-
314
-
315
-
316
-
317
-
318
-
319
-
320
-
321
-
322
-
323
-
324
-
325
-
326
-
327
-
328
-
329
-
330
-
331
-
332
-
333
-
334
-
335
-
336
-
337
-
338
-
339
-
340
-
341
-
342
-
343
-
344
-
345
-
346
-
347
-
348
-
349
-
350
-
351
-
352
-
353
-
354
-
355
-
356
-
357
-
358
-
359
-
360
-
361
-
362
-
363
-
364
-
365
-
366
-
367
-
368
-
369
-
370
-
371
-
372
-
373
-
374
-
375
-
376
-
377
-
378
 |
 |

HSBC HOLDINGS PLC
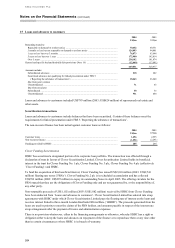
Notes on the Financial Statements (continued)
254
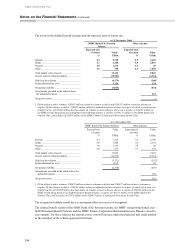
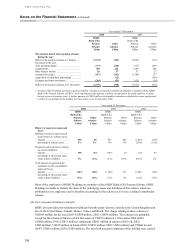
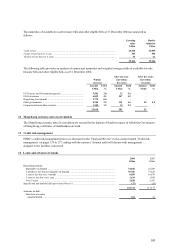
The assets in the defined benefit schemes and the expected rates of returns are:
At 31 December 2004
HSBC Bank (UK) Pension
Scheme
Other schemes
Expected rate
of return Value
Expected rate
of return Value
%US$m %US$m
Equities ............................................................. 8.1 8,728 9.5 2,639
Bonds ................................................................ 4.7 4,108 5.5 2,037
Property ............................................................. 6.5 1,536 6.5 68
Other .................................................................. 3.6 750 4.5 1,058
Total market value of assets .............................. 15,122 5,802
Present value of scheme liabilities ..................... (19,501) (6,362)
Deficit in the schemes ....................................... (4,379) (560)1
Related deferred tax asset .................................. 1,314 128
Net pension liability .......................................... (3,065) (432)
Net amounts provided in the balance sheet
for unfunded schemes ...................................... 433
Net pension asset ............................................... 1
1Of the deficit in other schemes, US$887 million related to schemes in deficit and US$327 million related to schemes in
surplus. Of the schemes in deficit, US$622 million related to unfunded pension schemes in respect of which a provision, net
of deferred tax, of US$433 million has been made. In relation to main schemes, there was a surplus of US$121 million in
the HSBC Group Hong Kong Local Staff Retirement Benefit Scheme, a surplus of US$131 million in the HSBC Bank USA
Pension Plan, and a deficit of US$19 million in the HSBC Finance Corporation Retirement Income Plan.
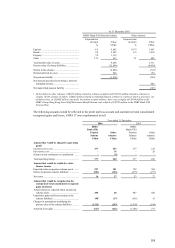
At 31 December 2003
HSBC Bank (UK) Pension Scheme Other schemes
Expected rate
of return
Value Expected rate
of return
Value
%US$m %US$m
Equities ............................................................. 8.5 7,232 9.3 2,740
Bonds ................................................................ 5.0 3,544 5.6 2,124
Property ............................................................. 7.0 1,167 7.0 26
Other .................................................................. 4.0 917 3.1 372
Total market value of assets .............................. 12,860 5,262
Present value of scheme liabilities ..................... (16,232) (5,514)
Deficit in the schemes ....................................... (3,372) (252)1
Related deferred tax asset .................................. 1,012 45
Net pension liability .......................................... (2,360) (207)
Net amounts provided in the balance sheet for
unfunded schemes.......................................... 388
Net pension asset................................................ 181
1Of the deficit in other schemes, US$679 million relates to schemes in deficit and US$427 million relates to schemes in
surplus. Of the schemes in deficit, US$514 million relates to unfunded pension schemes in respect of which a provision, net
of deferred tax, of US$388 million has been made. In relation to main schemes, there is a surplus of US$156 million in the
HSBC Group Hong Kong Local Staff Retirement Benefit Scheme, a surplus of US$112 million in the HSBC Bank USA
Pension Plan, and a surplus of US$71 million in the HSBC Finance Corporation Retirement Income Plan.
The net pension liability would have a consequent effect on reserves if recognised.
The defined benefit section of the HSBC Bank (UK) Pension Scheme, the HSBC Group Hong Kong Local
Staff Retirement Benefit Scheme and the HSBC Finance Corporation Retirement Income Plan are closed to
new entrants. For these schemes the current service cost will increase under the projected unit credit method
as the members of the scheme approach retirement.