HSBC 2004 Annual Report Download - page 182
Download and view the complete annual report
Please find page 182 of the 2004 HSBC annual report below. You can navigate through the pages in the report by either clicking on the pages listed below, or by using the keyword search tool below to find specific information within the annual report.-
 1
1 -
2
-
3
-
4
-
5
-
6
-
7
-
8
-
9
-
10
-
11
-
12
-
13
-
14
-
15
-
16
-
17
-
18
-
19
-
20
-
21
-
22
-
23
-
24
-
25
-
26
-
27
-
28
-
29
-
30
-
31
-
32
-
33
-
34
-
35
-
36
-
37
-
38
-
39
-
40
-
41
-
42
-
43
-
44
-
45
-
46
-
47
-
48
-
49
-
50
-
51
-
52
-
53
-
54
-
55
-
56
-
57
-
58
-
59
-
60
-
61
-
62
-
63
-
64
-
65
-
66
-
67
-
68
-
69
-
70
-
71
-
72
-
73
-
74
-
75
-
76
-
77
-
78
-
79
-
80
-
81
-
82
-
83
-
84
-
85
-
86
-
87
-
88
-
89
-
90
-
91
-
92
-
93
-
94
-
95
-
96
-
97
-
98
-
99
-
100
-
101
-
102
-
103
-
104
-
105
-
106
-
107
-
108
-
109
-
110
-
111
-
112
-
113
-
114
-
115
-
116
-
117
-
118
-
119
-
120
-
121
-
122
-
123
-
124
-
125
-
126
-
127
-
128
-
129
-
130
-
131
-
132
-
133
-
134
-
135
-
136
-
137
-
138
-
139
-
140
-
141
-
142
-
143
-
144
-
145
-
146
-
147
-
148
-
149
-
150
-
151
-
152
-
153
-
154
-
155
-
156
-
157
-
158
-
159
-
160
-
161
-
162
-
163
-
164
-
165
-
166
-
167
-
168
-
169
-
170
-
171
-
 172
172 -
 173
173 -
 174
174 -
 175
175 -
 176
176 -
 177
177 -
 178
178 -
 179
179 -
 180
180 -
 181
181 -
 182
182 -
 183
183 -
 184
184 -
 185
185 -
 186
186 -
 187
187 -
 188
188 -
 189
189 -
 190
190 -
 191
191 -
 192
192 -
193
-
194
-
195
-
196
-
197
-
198
-
199
-
200
-
201
-
202
-
203
-
204
-
205
-
206
-
207
-
208
-
209
-
210
-
211
-
212
-
213
-
214
-
215
-
216
-
217
-
218
-
219
-
220
-
221
-
222
-
223
-
224
-
225
-
226
-
227
-
228
-
229
-
230
-
231
-
232
-
233
-
234
-
235
-
236
-
237
-
238
-
239
-
240
-
241
-
242
-
243
-
244
-
245
-
246
-
247
-
248
-
249
-
250
-
251
-
252
-
253
-
254
-
255
-
256
-
257
-
258
-
259
-
260
-
261
-
262
-
263
-
264
-
265
-
266
-
267
-
268
-
269
-
270
-
271
-
272
-
273
-
274
-
275
-
276
-
277
-
278
-
279
-
280
-
281
-
282
-
283
-
284
-
285
-
286
-
287
-
288
-
289
-
290
-
291
-
292
-
293
-
294
-
295
-
296
-
297
-
298
-
299
-
300
-
301
-
302
-
303
-
304
-
305
-
306
-
307
-
308
-
309
-
310
-
311
-
312
-
313
-
314
-
315
-
316
-
317
-
318
-
319
-
320
-
321
-
322
-
323
-
324
-
325
-
326
-
327
-
328
-
329
-
330
-
331
-
332
-
333
-
334
-
335
-
336
-
337
-
338
-
339
-
340
-
341
-
342
-
343
-
344
-
345
-
346
-
347
-
348
-
349
-
350
-
351
-
352
-
353
-
354
-
355
-
356
-
357
-
358
-
359
-
360
-
361
-
362
-
363
-
364
-
365
-
366
-
367
-
368
-
369
-
370
-
371
-
372
-
373
-
374
-
375
-
376
-
377
-
378
 |
 |

HSBC HOLDINGS PLC
Other information (continued)
180
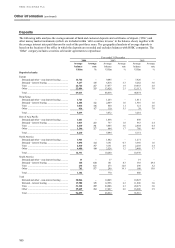
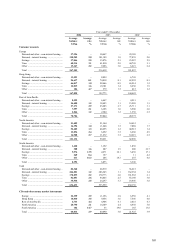
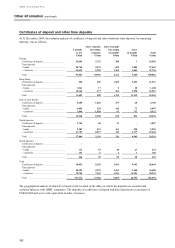
Deposits
The following table analyses the average amount of bank and customer deposits and certificates of deposit (‘CDs’ ) and
other money market instruments (which are included within ‘debt securities in issue’ in the balance sheet), together with
the average interest rates paid thereon for each of the past three years. The geographical analysis of average deposits is
based on the location of the office in which the deposits are recorded and excludes balances with HSBC companies. The
‘Other’ category includes securities sold under agreements to repurchase.
Year ended 31 December
2004 2003 2002
Average
balance
Average
rate
Average
balance
Average
rate
Average
balance
Average
rate
US$m % US$m % US$m %
Deposits by banks
Europe
Demand and other – non-interest bearing ........... 14,746 – 9,895 – 7,626 –
Demand – interest bearing .................................. 9,237 1.5 6,418 3.3 5,282 3.0
Time ................................................................... 22,746 2.7 17,877 1.9 19,053 2.8
Other ................................................................... 22,884 2.5 13,828 2.5 12,113 3.0
Total .................................................................... 69,613 48,018 44,074
Hong Kong
Demand and other – non-interest bearing ........... 1,723 – 1,253 – 1,011 –
Demand – interest bearing .................................. 2,484 1.2 2,059 1.0 1,910 1.6
Time ................................................................... 1,016 1.6 450 1.1 321 2.0
Other ................................................................... 416 1.7 110 5.5 39 7.0
Total .................................................................... 5,639 3,872 3,281
Rest of Asia-Pacific
Demand and other – non-interest bearing ........... 1,641 – 1,438 – 898 –
Demand – interest bearing .................................. 1,013 2.3 737 1.8 663 2.4
Time ................................................................... 4,410 3.1 3,055 3.6 2,804 4.4
Other ................................................................... 1,146 2.7 664 1.7 786 4.6
Total .................................................................... 8,210 5,894 5,151
North America
Demand and other – non-interest bearing ........... 1,943 – 1,442 – 1,271 –
Demand – interest bearing .................................. 3,098 1.4 3,161 0.7 3,566 1.0
Time ................................................................... 2,810 3.7 3,151 2.9 2,205 2.4
Other ................................................................... 4,480 1.8 2,526 1.2 3,488 1.7
Total .................................................................... 12,331 10,280 10,530
South America
Demand and other – non-interest bearing ........... 13 – 17 – 19 –
Demand – interest bearing .................................. 148 6.8 181 8.3 385 29.4
Time ................................................................... 238 6.3 273 12.8 296 5.2
Other ................................................................... 703 5.7 299 19.1 180 15.0
Total .................................................................... 1,102 770 880
Total
Demand and other – non-interest bearing ........... 20,066 – 14,045 – 10,825 –
Demand – interest bearing .................................. 15,980 1.5 12,556 2.2 11,806 3.0
Time ................................................................... 31,220 2.9 24,806 2.3 24,679 3.0
Other ................................................................... 29,629 2.4 17,427 2.6 16,606 2.9
Total .................................................................... 96,895 68,834 63,916