HSBC 2004 Annual Report Download - page 163
Download and view the complete annual report
Please find page 163 of the 2004 HSBC annual report below. You can navigate through the pages in the report by either clicking on the pages listed below, or by using the keyword search tool below to find specific information within the annual report.-
 1
1 -
2
-
3
-
4
-
5
-
6
-
7
-
8
-
9
-
10
-
11
-
12
-
13
-
14
-
15
-
16
-
17
-
18
-
19
-
20
-
21
-
22
-
23
-
24
-
25
-
26
-
27
-
28
-
29
-
30
-
31
-
32
-
33
-
34
-
35
-
36
-
37
-
38
-
39
-
40
-
41
-
42
-
43
-
44
-
45
-
46
-
47
-
48
-
49
-
50
-
51
-
52
-
53
-
54
-
55
-
56
-
57
-
58
-
59
-
60
-
61
-
62
-
63
-
64
-
65
-
66
-
67
-
68
-
69
-
70
-
71
-
72
-
73
-
74
-
75
-
76
-
77
-
78
-
79
-
80
-
81
-
82
-
83
-
84
-
85
-
86
-
87
-
88
-
89
-
90
-
91
-
92
-
93
-
94
-
95
-
96
-
97
-
98
-
99
-
100
-
101
-
102
-
103
-
104
-
105
-
106
-
107
-
108
-
109
-
110
-
111
-
112
-
113
-
114
-
115
-
116
-
117
-
118
-
119
-
120
-
121
-
122
-
123
-
124
-
125
-
126
-
127
-
128
-
129
-
130
-
131
-
132
-
133
-
134
-
135
-
136
-
137
-
138
-
139
-
140
-
141
-
142
-
143
-
144
-
145
-
146
-
147
-
148
-
149
-
150
-
151
-
152
-
 153
153 -
 154
154 -
 155
155 -
 156
156 -
 157
157 -
 158
158 -
 159
159 -
 160
160 -
 161
161 -
 162
162 -
 163
163 -
 164
164 -
 165
165 -
 166
166 -
 167
167 -
 168
168 -
 169
169 -
 170
170 -
 171
171 -
 172
172 -
 173
173 -
174
-
175
-
176
-
177
-
178
-
179
-
180
-
181
-
182
-
183
-
184
-
185
-
186
-
187
-
188
-
189
-
190
-
191
-
192
-
193
-
194
-
195
-
196
-
197
-
198
-
199
-
200
-
201
-
202
-
203
-
204
-
205
-
206
-
207
-
208
-
209
-
210
-
211
-
212
-
213
-
214
-
215
-
216
-
217
-
218
-
219
-
220
-
221
-
222
-
223
-
224
-
225
-
226
-
227
-
228
-
229
-
230
-
231
-
232
-
233
-
234
-
235
-
236
-
237
-
238
-
239
-
240
-
241
-
242
-
243
-
244
-
245
-
246
-
247
-
248
-
249
-
250
-
251
-
252
-
253
-
254
-
255
-
256
-
257
-
258
-
259
-
260
-
261
-
262
-
263
-
264
-
265
-
266
-
267
-
268
-
269
-
270
-
271
-
272
-
273
-
274
-
275
-
276
-
277
-
278
-
279
-
280
-
281
-
282
-
283
-
284
-
285
-
286
-
287
-
288
-
289
-
290
-
291
-
292
-
293
-
294
-
295
-
296
-
297
-
298
-
299
-
300
-
301
-
302
-
303
-
304
-
305
-
306
-
307
-
308
-
309
-
310
-
311
-
312
-
313
-
314
-
315
-
316
-
317
-
318
-
319
-
320
-
321
-
322
-
323
-
324
-
325
-
326
-
327
-
328
-
329
-
330
-
331
-
332
-
333
-
334
-
335
-
336
-
337
-
338
-
339
-
340
-
341
-
342
-
343
-
344
-
345
-
346
-
347
-
348
-
349
-
350
-
351
-
352
-
353
-
354
-
355
-
356
-
357
-
358
-
359
-
360
-
361
-
362
-
363
-
364
-
365
-
366
-
367
-
368
-
369
-
370
-
371
-
372
-
373
-
374
-
375
-
376
-
377
-
378
 |
 |

161
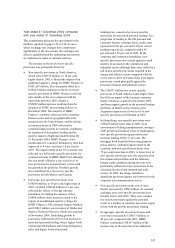
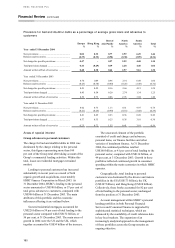
In view of the high levels of personal
indebtedness in many of the world’ s leading
economies, guidelines for the restructuring of
customer facilities in the event of financial difficulty
have been reinforced.
In the US, the strength of the housing market
continued unabated, driven mainly by affordability.
Low interest rates, lower transaction costs and
increased availability of credit all fuelled the rise in
demand. However, recent rises in interest rates are
likely to affect growth adversely and add pressure to
some borrowers, particularly in certain overpriced
locations. The portfolios, however, remain
geographically diverse and are secured largely by
senior lien positions.
Although increased mortgage borrowing has
contributed to the record level of consumer debt,
levels have largely stabilised and are expected to
decline gradually, as incomes rise sufficiently to pay
down debt, notwithstanding higher interest rates.
Against this background, delinquency rates fell
across the majority of portfolios during 2004 and
trends in lending quality showed an improvement.
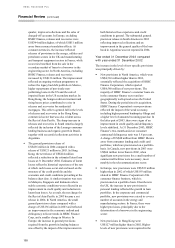
Personal lending in the UK also continued to
grow strongly, particularly in the mortgage market.
This secured portfolio, representing 55 per cent of
total lending to personal customers in the UK,
continued to suffer negligible delinquency and
losses. The unsecured portfolio also continued to
expand both through organic growth and with the
acquisition of Marks and Spencer Financial Services,
which added US$5.3 billion to the portfolio in
November 2004. Underwriting criteria were
regularly reviewed to ensure that they remained
appropriate in prevailing market conditions, which
have seen a steady rise in personal bankruptcies and
delinquencies over the course of the year.
With consumer spending rising in Hong Kong
and the levels of bankruptcies and unemployment
both falling, the improvement in the personal
portfolios, which first became evident during the
second half of 2003, continued throughout 2004.
With ongoing property price increases a feature of
2004, the most notable trend was the continued
reduction in the level of negative equity on mortgage
balances, which is now at modest levels.
Across the other geographical regions the
position remained relatively stable, although HSBC
continued to monitor carefully those portfolios that
have the greatest potential for future economic
stress. Delinquency and loss trends differed across
jurisdictions, reflecting these varied conditions.
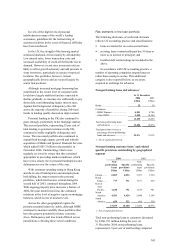
Risk elements in the loan portfolio
The following disclosure of credit risk elements
reflects US accounting practice and classifications:
• loans accounted for on a non-accrual basis;
• accruing loans contractually past due 90 days or
more as to interest or principal; and
• troubled debt restructurings not included in the
above.
In accordance with UK accounting practice, a
number of operating companies suspend interest
rather than ceasing to accrue. This additional
category is also reported below, as are assets
acquired in exchange for advances.
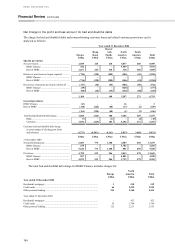
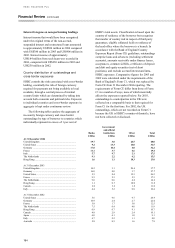
Non-performing loans and advances1
At 31 December
2004
US$m
2003
US$m
Banks ........................................ 25 24
Customers
– HSBC Finance ....................... 4,201 4,706
– Other HSBC............................ 9,058 10,344
13,259 15,050
Total non-performing loans
and advances........................... 13,284 15,074
Total provisions cover as a
percentage of non-performing
loans and advances ................. 95.5% 91.0%
1 Net of suspended interest.
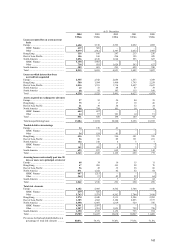
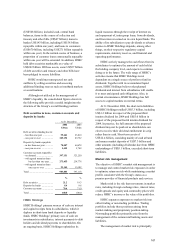
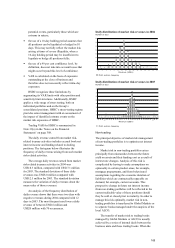
Non-performing customer loans1 and related
specific provisions outstanding by geographical
segment
2004 2003
Non-
performing
loans
Specific
provisions
Non-
performing
loans
Specific
provisions
US$m US$m US$m US$m
Europe ...... 6,065 4,036 5,701 3,554
Hong
Kong ...... 773 331 1,671 629
Rest of
Asia-
Pacific .... 1,180 791 1,538 981
North
America . 4,583 4,420 5,444 5,184
South
America 658 522 696 530
13,259 10,100 15,050 10,878
1 Net of suspended interest.
Total non-performing loans to customers decreased
by US$1,791 million during the year. At
31 December 2004, non-performing loans
represented 1.9 per cent of total lending compared