HSBC 2004 Annual Report Download - page 265
Download and view the complete annual report
Please find page 265 of the 2004 HSBC annual report below. You can navigate through the pages in the report by either clicking on the pages listed below, or by using the keyword search tool below to find specific information within the annual report.-
 1
1 -
2
-
3
-
4
-
5
-
6
-
7
-
8
-
9
-
10
-
11
-
12
-
13
-
14
-
15
-
16
-
17
-
18
-
19
-
20
-
21
-
22
-
23
-
24
-
25
-
26
-
27
-
28
-
29
-
30
-
31
-
32
-
33
-
34
-
35
-
36
-
37
-
38
-
39
-
40
-
41
-
42
-
43
-
44
-
45
-
46
-
47
-
48
-
49
-
50
-
51
-
52
-
53
-
54
-
55
-
56
-
57
-
58
-
59
-
60
-
61
-
62
-
63
-
64
-
65
-
66
-
67
-
68
-
69
-
70
-
71
-
72
-
73
-
74
-
75
-
76
-
77
-
78
-
79
-
80
-
81
-
82
-
83
-
84
-
85
-
86
-
87
-
88
-
89
-
90
-
91
-
92
-
93
-
94
-
95
-
96
-
97
-
98
-
99
-
100
-
101
-
102
-
103
-
104
-
105
-
106
-
107
-
108
-
109
-
110
-
111
-
112
-
113
-
114
-
115
-
116
-
117
-
118
-
119
-
120
-
121
-
122
-
123
-
124
-
125
-
126
-
127
-
128
-
129
-
130
-
131
-
132
-
133
-
134
-
135
-
136
-
137
-
138
-
139
-
140
-
141
-
142
-
143
-
144
-
145
-
146
-
147
-
148
-
149
-
150
-
151
-
152
-
153
-
154
-
155
-
156
-
157
-
158
-
159
-
160
-
161
-
162
-
163
-
164
-
165
-
166
-
167
-
168
-
169
-
170
-
171
-
172
-
173
-
174
-
175
-
176
-
177
-
178
-
179
-
180
-
181
-
182
-
183
-
184
-
185
-
186
-
187
-
188
-
189
-
190
-
191
-
192
-
193
-
194
-
195
-
196
-
197
-
198
-
199
-
200
-
201
-
202
-
203
-
204
-
205
-
206
-
207
-
208
-
209
-
210
-
211
-
212
-
213
-
214
-
215
-
216
-
217
-
218
-
219
-
220
-
221
-
222
-
223
-
224
-
225
-
226
-
227
-
228
-
229
-
230
-
231
-
232
-
233
-
234
-
235
-
236
-
237
-
238
-
239
-
240
-
241
-
242
-
243
-
244
-
245
-
246
-
247
-
248
-
249
-
250
-
251
-
252
-
253
-
254
-
 255
255 -
 256
256 -
 257
257 -
 258
258 -
 259
259 -
 260
260 -
 261
261 -
 262
262 -
 263
263 -
 264
264 -
 265
265 -
 266
266 -
 267
267 -
 268
268 -
 269
269 -
 270
270 -
 271
271 -
 272
272 -
 273
273 -
 274
274 -
 275
275 -
276
-
277
-
278
-
279
-
280
-
281
-
282
-
283
-
284
-
285
-
286
-
287
-
288
-
289
-
290
-
291
-
292
-
293
-
294
-
295
-
296
-
297
-
298
-
299
-
300
-
301
-
302
-
303
-
304
-
305
-
306
-
307
-
308
-
309
-
310
-
311
-
312
-
313
-
314
-
315
-
316
-
317
-
318
-
319
-
320
-
321
-
322
-
323
-
324
-
325
-
326
-
327
-
328
-
329
-
330
-
331
-
332
-
333
-
334
-
335
-
336
-
337
-
338
-
339
-
340
-
341
-
342
-
343
-
344
-
345
-
346
-
347
-
348
-
349
-
350
-
351
-
352
-
353
-
354
-
355
-
356
-
357
-
358
-
359
-
360
-
361
-
362
-
363
-
364
-
365
-
366
-
367
-
368
-
369
-
370
-
371
-
372
-
373
-
374
-
375
-
376
-
377
-
378
 |
 |

263
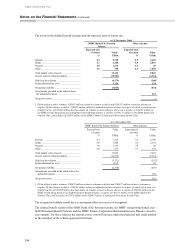
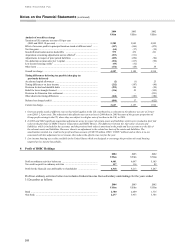
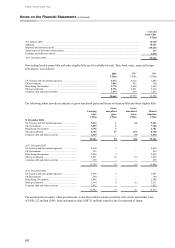
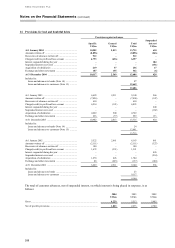
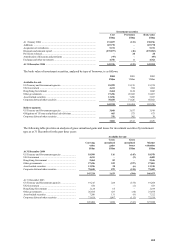
The maturities of available-for-sale treasury bills and other eligible bills at 31 December 2004 are analysed as
follows:
Carrying
value
Market
valuation
US$m US$m
1 year or less ................................................................................................................................... 25,018 25,009
5 years or less but over 1 year ......................................................................................................... 593 596
10 years or less but over 5 years ...................................................................................................... 55 61
25,666 25,666
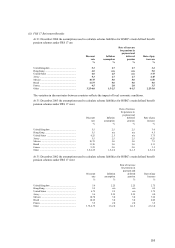
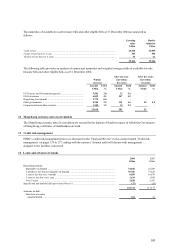
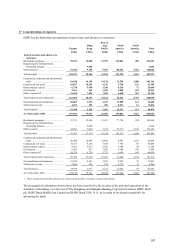
The following table provides an analysis of contractual maturities and weighted average yields of available-for-sale
treasury bills and other eligible bills as at 31 December 2004.
Within
one year
After one year
but within
five years
After five years
but within
ten years
Amount Yield Amount Yield Amount Yield
US$m % US$m % US$m %
US Treasury and Government agencies .................................... 5,502 2.0 12 5.6 ––
UK Government ........................................................................ 6,852 4.2 247 4.9 ––
Hong Kong Government ........................................................... 2,778 0.6 –– ––
Other governments .................................................................... 8,386 2.5 315 4.6 55 4.2
Corporate debt and other securities ........................................... 1,500 1.2 19 2.2 ––
25,018 593 55
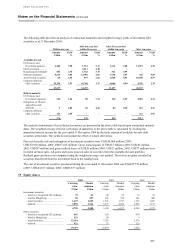
12 Hong Kong currency notes in circulation
The Hong Kong currency notes in circulation are secured by the deposit of funds in respect of which the Government
of Hong Kong certificates of indebtedness are held.
13 Credit risk management
HSBC’ s credit risk management process is discussed in the ‘Financial Review’ in the section headed ‘Credit risk
management’ on pages 135 to 137, ending with the sentence ‘Internal audit will discuss with management …
assigned to the facilities concerned’ .
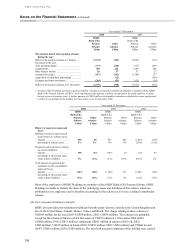
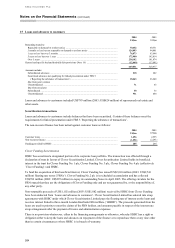
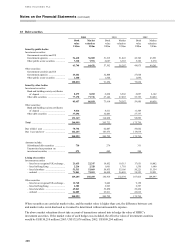
14 Loans and advances to banks
2004 2003
US$m US$m
Remaining maturity:
Repayable on demand ................................................................................................................. 34,842 25,289
3 months or less but not repayable on demand ............................................................................ 95,386 77,188
1 year or less but over 3 months ................................................................................................. 8,059 10,879
5 years or less but over 1 year ..................................................................................................... 1,614 1,454
Over 5 years ................................................................................................................................ 2,828 2,387
Specific bad and doubtful debt provisions (Note 16) ...................................................................... (17) (24)
142,712 117,173
Amounts include:
Due from associates
– unsubordinated ......................................................................................................................... 164 21