HSBC 2004 Annual Report Download - page 73
Download and view the complete annual report
Please find page 73 of the 2004 HSBC annual report below. You can navigate through the pages in the report by either clicking on the pages listed below, or by using the keyword search tool below to find specific information within the annual report.-
 1
1 -
2
-
3
-
4
-
5
-
6
-
7
-
8
-
9
-
10
-
11
-
12
-
13
-
14
-
15
-
16
-
17
-
18
-
19
-
20
-
21
-
22
-
23
-
24
-
25
-
26
-
27
-
28
-
29
-
30
-
31
-
32
-
33
-
34
-
35
-
36
-
37
-
38
-
39
-
40
-
41
-
42
-
43
-
44
-
45
-
46
-
47
-
48
-
49
-
50
-
51
-
52
-
53
-
54
-
55
-
56
-
57
-
58
-
59
-
60
-
61
-
62
-
 63
63 -
 64
64 -
 65
65 -
 66
66 -
 67
67 -
 68
68 -
 69
69 -
 70
70 -
 71
71 -
 72
72 -
 73
73 -
 74
74 -
 75
75 -
 76
76 -
 77
77 -
 78
78 -
 79
79 -
 80
80 -
 81
81 -
 82
82 -
 83
83 -
84
-
85
-
86
-
87
-
88
-
89
-
90
-
91
-
92
-
93
-
94
-
95
-
96
-
97
-
98
-
99
-
100
-
101
-
102
-
103
-
104
-
105
-
106
-
107
-
108
-
109
-
110
-
111
-
112
-
113
-
114
-
115
-
116
-
117
-
118
-
119
-
120
-
121
-
122
-
123
-
124
-
125
-
126
-
127
-
128
-
129
-
130
-
131
-
132
-
133
-
134
-
135
-
136
-
137
-
138
-
139
-
140
-
141
-
142
-
143
-
144
-
145
-
146
-
147
-
148
-
149
-
150
-
151
-
152
-
153
-
154
-
155
-
156
-
157
-
158
-
159
-
160
-
161
-
162
-
163
-
164
-
165
-
166
-
167
-
168
-
169
-
170
-
171
-
172
-
173
-
174
-
175
-
176
-
177
-
178
-
179
-
180
-
181
-
182
-
183
-
184
-
185
-
186
-
187
-
188
-
189
-
190
-
191
-
192
-
193
-
194
-
195
-
196
-
197
-
198
-
199
-
200
-
201
-
202
-
203
-
204
-
205
-
206
-
207
-
208
-
209
-
210
-
211
-
212
-
213
-
214
-
215
-
216
-
217
-
218
-
219
-
220
-
221
-
222
-
223
-
224
-
225
-
226
-
227
-
228
-
229
-
230
-
231
-
232
-
233
-
234
-
235
-
236
-
237
-
238
-
239
-
240
-
241
-
242
-
243
-
244
-
245
-
246
-
247
-
248
-
249
-
250
-
251
-
252
-
253
-
254
-
255
-
256
-
257
-
258
-
259
-
260
-
261
-
262
-
263
-
264
-
265
-
266
-
267
-
268
-
269
-
270
-
271
-
272
-
273
-
274
-
275
-
276
-
277
-
278
-
279
-
280
-
281
-
282
-
283
-
284
-
285
-
286
-
287
-
288
-
289
-
290
-
291
-
292
-
293
-
294
-
295
-
296
-
297
-
298
-
299
-
300
-
301
-
302
-
303
-
304
-
305
-
306
-
307
-
308
-
309
-
310
-
311
-
312
-
313
-
314
-
315
-
316
-
317
-
318
-
319
-
320
-
321
-
322
-
323
-
324
-
325
-
326
-
327
-
328
-
329
-
330
-
331
-
332
-
333
-
334
-
335
-
336
-
337
-
338
-
339
-
340
-
341
-
342
-
343
-
344
-
345
-
346
-
347
-
348
-
349
-
350
-
351
-
352
-
353
-
354
-
355
-
356
-
357
-
358
-
359
-
360
-
361
-
362
-
363
-
364
-
365
-
366
-
367
-
368
-
369
-
370
-
371
-
372
-
373
-
374
-
375
-
376
-
377
-
378
 |
 |

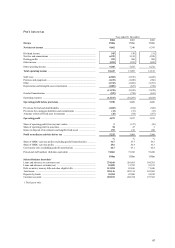
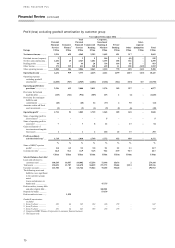
71
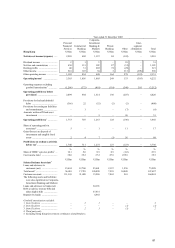
Year ended 31 December 2003
Europe
Personal
Financial
Services
US$m
Consumer
Finance
US$m
4
Total
Personal
Financial
Services
US$m
Commercial
Banking
US$m
Corporate,
Investment
Banking &
Markets
US$m
Private
Banking
US$m
Other
US$m
Inter-
segment
elimination
US$m
Total
US$m
Net interest income .......... 3,082 438 3,520 1,961 1,509 334 216 – 7,540
Dividend income ............... 4 – 4 2 138 2 4 – 150
Net fees and commissions . 1,789 49 1,838 1,335 1,204 556 259 – 5,192
Dealing profits/(losses) ..... 37 – 37 16 839 94 (26) – 960
Other income ..................... 129 149 278 294 539 10 371 (239) 1,253
Other operating income ..... 1,959 198 2,157 1,647 2,720 662 608 (239) 7,555
Operating income ............ 5,041 636 5,677 3,608 4,229 996 824 (239) 15,095
Operating expenses
excluding goodwill
amortisation1 ................ (3,471) (299) (3,770) (2,113) (2,471) (709) (705) 239 (9,529)
Operating profit before
provisions1 ................... 1,570 337 1,907 1,495 1,758 287 119 – 5,566
Provisions for bad and
doubtful debts ............... (267) (180) (447) (204) (218) (4) (1) – (874)
Provisions for contingent
liabilities and
commitments ................ (29) – (29) 10 (52) (2) 40 – (33)
Amounts written off fixed
asset investments .......... (1) – (1) – (42) (3) (18) – (64)
Operating profit1 ............. 1,273 157 1,430 1,301 1,446 278 140 – 4,595
Share of operating profit in
joint ventures2 .............. – – – – 8 – – – 8
Share of operating profit
in associates ................. 3 – 3 3 13 – 28 – 47
Gains/(losses) on disposal
of investments and
tangible fixed assets ..... (9) – (9) (1) 156 61 5 – 212
Profit on ordinary
activities before tax3 ... 1,267 157 1,424 1,303 1,623 339 173 – 4,862
%% %%%%% %
Share of HSBC’ s pre-tax
profits3 .......................... 8.8 1.1 9.9 9.0 11.3 2.4 1.1 33.7
Cost:income ratio1 ............. 68.9 47.0 66.4 58.6 58.4 71.2 85.6 63.1
US$m US$m US$m US$m US$m US$m US$m US$m
Selected balance sheet data5
Loans and advances to
customers (net) ............. 76,439 8,452 84,891 52,947 61,085 11,681 1 210,605
Total assets ....................... 92,890 10,526 103,416 67,107 209,885 40,964 3,940 425,312
Customer accounts ............ 102,192 231 102,423 45,558 63,556 31,187 – 242,724
The following assets and
liabilities were significant
to the customer groups
noted:
Loans and advances to banks
(net) .............................. 43,699
Debt securities, treasury bills
and other eligible bills .. 67,692
Deposits by banks ............. 44,261
Debt securities in issue ...... 3,232
Goodwill amortisation
excluded:
1from (1) above .............. 123 23 146 160 192 257 3 758
2from (2) above .............. – – – – 135 – – 135
3from (3) above .............. 123 23 146 160 327 257 3 893
4Comprises HSBC Finance Corporation’s consumer finance business since the date of acquisition.
5Third party only.