HSBC 2004 Annual Report Download - page 51
Download and view the complete annual report
Please find page 51 of the 2004 HSBC annual report below. You can navigate through the pages in the report by either clicking on the pages listed below, or by using the keyword search tool below to find specific information within the annual report.-
 1
1 -
2
-
3
-
4
-
5
-
6
-
7
-
8
-
9
-
10
-
11
-
12
-
13
-
14
-
15
-
16
-
17
-
18
-
19
-
20
-
21
-
22
-
23
-
24
-
25
-
26
-
27
-
28
-
29
-
30
-
31
-
32
-
33
-
34
-
35
-
36
-
37
-
38
-
39
-
40
-
 41
41 -
 42
42 -
 43
43 -
 44
44 -
 45
45 -
 46
46 -
 47
47 -
 48
48 -
 49
49 -
 50
50 -
 51
51 -
 52
52 -
 53
53 -
 54
54 -
 55
55 -
 56
56 -
 57
57 -
 58
58 -
 59
59 -
 60
60 -
 61
61 -
62
-
63
-
64
-
65
-
66
-
67
-
68
-
69
-
70
-
71
-
72
-
73
-
74
-
75
-
76
-
77
-
78
-
79
-
80
-
81
-
82
-
83
-
84
-
85
-
86
-
87
-
88
-
89
-
90
-
91
-
92
-
93
-
94
-
95
-
96
-
97
-
98
-
99
-
100
-
101
-
102
-
103
-
104
-
105
-
106
-
107
-
108
-
109
-
110
-
111
-
112
-
113
-
114
-
115
-
116
-
117
-
118
-
119
-
120
-
121
-
122
-
123
-
124
-
125
-
126
-
127
-
128
-
129
-
130
-
131
-
132
-
133
-
134
-
135
-
136
-
137
-
138
-
139
-
140
-
141
-
142
-
143
-
144
-
145
-
146
-
147
-
148
-
149
-
150
-
151
-
152
-
153
-
154
-
155
-
156
-
157
-
158
-
159
-
160
-
161
-
162
-
163
-
164
-
165
-
166
-
167
-
168
-
169
-
170
-
171
-
172
-
173
-
174
-
175
-
176
-
177
-
178
-
179
-
180
-
181
-
182
-
183
-
184
-
185
-
186
-
187
-
188
-
189
-
190
-
191
-
192
-
193
-
194
-
195
-
196
-
197
-
198
-
199
-
200
-
201
-
202
-
203
-
204
-
205
-
206
-
207
-
208
-
209
-
210
-
211
-
212
-
213
-
214
-
215
-
216
-
217
-
218
-
219
-
220
-
221
-
222
-
223
-
224
-
225
-
226
-
227
-
228
-
229
-
230
-
231
-
232
-
233
-
234
-
235
-
236
-
237
-
238
-
239
-
240
-
241
-
242
-
243
-
244
-
245
-
246
-
247
-
248
-
249
-
250
-
251
-
252
-
253
-
254
-
255
-
256
-
257
-
258
-
259
-
260
-
261
-
262
-
263
-
264
-
265
-
266
-
267
-
268
-
269
-
270
-
271
-
272
-
273
-
274
-
275
-
276
-
277
-
278
-
279
-
280
-
281
-
282
-
283
-
284
-
285
-
286
-
287
-
288
-
289
-
290
-
291
-
292
-
293
-
294
-
295
-
296
-
297
-
298
-
299
-
300
-
301
-
302
-
303
-
304
-
305
-
306
-
307
-
308
-
309
-
310
-
311
-
312
-
313
-
314
-
315
-
316
-
317
-
318
-
319
-
320
-
321
-
322
-
323
-
324
-
325
-
326
-
327
-
328
-
329
-
330
-
331
-
332
-
333
-
334
-
335
-
336
-
337
-
338
-
339
-
340
-
341
-
342
-
343
-
344
-
345
-
346
-
347
-
348
-
349
-
350
-
351
-
352
-
353
-
354
-
355
-
356
-
357
-
358
-
359
-
360
-
361
-
362
-
363
-
364
-
365
-
366
-
367
-
368
-
369
-
370
-
371
-
372
-
373
-
374
-
375
-
376
-
377
-
378
 |
 |

49
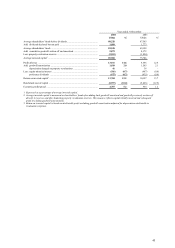
Consumer Finance
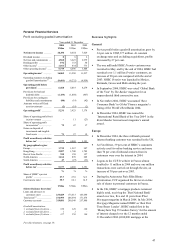
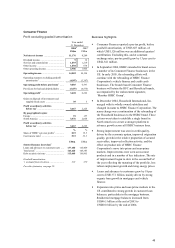
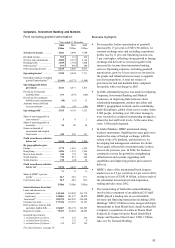
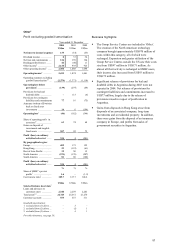
Profit excluding goodwill amortisation Business highlights
Year ended
31 December
2004420035
US$m US$m
Net interest income ................................. 11,176 8,289
Dividend income ....................................... 912
Net fees and commissions ......................... 1,893 1,219
Other income ............................................ 1,004 674
Other operating income ............................. 2,906 1,905
Operating income .................................... 14,082 10,194
Operating expenses excluding goodwill
amortisation1 ......................................... (4,997) (3,397)
Operating profit before provisions1 ....... 9,085 6,797
Provisions for bad and doubtful debts ....... (5,457) (4,575)
Operating profit1 ..................................... 3,628 2,222
Gains on disposal of investments and
tangible fixed assets .............................. 39 3
Profit on ordinary activities
before tax1 ............................................ 3,667 2,225
By geographical region:
Europe ....................................................... 91 157
North America .......................................... 3,576 2,068
Profit on ordinary activities
before tax1 ............................................ 3,667 2,225
%%
Share of HSBC’ s pre-tax profits1 .............. 18.9 15.5
Cost:income ratio1 ..................................... 35.5 33.3
US$m US$m
Selected balance sheet data7
Loans and advances to customers (net) ..... 137,100 116,409
Total assets8 ............................................... 163,420 145,383
Debt securities in issue .............................. 115,668 110,905
Goodwill amortisation:
1excluded from (1) above ........................ 519 379
For other footnotes, see page 59.
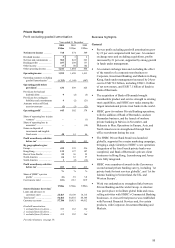
• Consumer Finance reported a pre-tax profit, before
goodwill amortisation, of US$3,667 million, of
which US$1,126 million was an additional quarters’
contribution. Excluding this, and at constrant
exchange rates, pre-tax profit grew by 13 per cent to
US$2,541 million.
• In September 2004, HSBC extended its brand across
a number of its Consumer Finance businesses in the
US. In early 2005, the rebranding efforts will
continue with the rebranding of HSBC Finance
Corporation’ s vehicle finance and credit cards
businesses. The branch based Consumer Finance
business will retain the HFC and Beneficial brands,
accompanied by the endorsement signature,
‘Member HSBC Group’ .
• In December 2004, Household International, Inc.
merged with its wholly owned subsidiary and
changed its name to HSBC Finance Corporation. The
name change was a continuation of the rebranding of
the Household businesses to the HSBC brand. These
actions were taken to establish a single brand in
North America to create a stronger platform to
advance growth across all HSBC business lines.
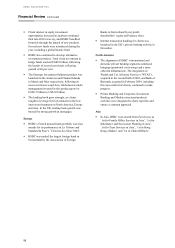
• Strong improvement was seen in credit quality,
driven by the economic upturn, improved origination
quality, growth in the relative proportion of secured
receivables, improved collection activity, and the
effect on product mix of HSBC Finance
Corporation’ s move into prime and near-prime
markets. Improvements were seen across most
products and in a number of key indicators. The rate
of improvement began to slow in the second half of
the year reflecting the maturing of the portfolio, less
robust employment growth and rising energy prices.
• Loans and advances to customers grew by 18 per
cent to US$137.1 billion, mainly driven by strong
organic loan growth in mortgages and vehicle
finance.
• Expansion into prime and near-prime markets in the
US contributed to strong growth in customer loan
balances, particularly in the mortgage business.
Residential mortgage balances increased from
US$46.1 billion at the end of 2003 to
US$60.8 billion by the end of 2004.