HSBC 2004 Annual Report Download - page 274
Download and view the complete annual report
Please find page 274 of the 2004 HSBC annual report below. You can navigate through the pages in the report by either clicking on the pages listed below, or by using the keyword search tool below to find specific information within the annual report.-
 1
1 -
2
-
3
-
4
-
5
-
6
-
7
-
8
-
9
-
10
-
11
-
12
-
13
-
14
-
15
-
16
-
17
-
18
-
19
-
20
-
21
-
22
-
23
-
24
-
25
-
26
-
27
-
28
-
29
-
30
-
31
-
32
-
33
-
34
-
35
-
36
-
37
-
38
-
39
-
40
-
41
-
42
-
43
-
44
-
45
-
46
-
47
-
48
-
49
-
50
-
51
-
52
-
53
-
54
-
55
-
56
-
57
-
58
-
59
-
60
-
61
-
62
-
63
-
64
-
65
-
66
-
67
-
68
-
69
-
70
-
71
-
72
-
73
-
74
-
75
-
76
-
77
-
78
-
79
-
80
-
81
-
82
-
83
-
84
-
85
-
86
-
87
-
88
-
89
-
90
-
91
-
92
-
93
-
94
-
95
-
96
-
97
-
98
-
99
-
100
-
101
-
102
-
103
-
104
-
105
-
106
-
107
-
108
-
109
-
110
-
111
-
112
-
113
-
114
-
115
-
116
-
117
-
118
-
119
-
120
-
121
-
122
-
123
-
124
-
125
-
126
-
127
-
128
-
129
-
130
-
131
-
132
-
133
-
134
-
135
-
136
-
137
-
138
-
139
-
140
-
141
-
142
-
143
-
144
-
145
-
146
-
147
-
148
-
149
-
150
-
151
-
152
-
153
-
154
-
155
-
156
-
157
-
158
-
159
-
160
-
161
-
162
-
163
-
164
-
165
-
166
-
167
-
168
-
169
-
170
-
171
-
172
-
173
-
174
-
175
-
176
-
177
-
178
-
179
-
180
-
181
-
182
-
183
-
184
-
185
-
186
-
187
-
188
-
189
-
190
-
191
-
192
-
193
-
194
-
195
-
196
-
197
-
198
-
199
-
200
-
201
-
202
-
203
-
204
-
205
-
206
-
207
-
208
-
209
-
210
-
211
-
212
-
213
-
214
-
215
-
216
-
217
-
218
-
219
-
220
-
221
-
222
-
223
-
224
-
225
-
226
-
227
-
228
-
229
-
230
-
231
-
232
-
233
-
234
-
235
-
236
-
237
-
238
-
239
-
240
-
241
-
242
-
243
-
244
-
245
-
246
-
247
-
248
-
249
-
250
-
251
-
252
-
253
-
254
-
255
-
256
-
257
-
258
-
259
-
260
-
261
-
262
-
263
-
 264
264 -
 265
265 -
 266
266 -
 267
267 -
 268
268 -
 269
269 -
 270
270 -
 271
271 -
 272
272 -
 273
273 -
 274
274 -
 275
275 -
 276
276 -
 277
277 -
 278
278 -
 279
279 -
 280
280 -
 281
281 -
 282
282 -
 283
283 -
 284
284 -
285
-
286
-
287
-
288
-
289
-
290
-
291
-
292
-
293
-
294
-
295
-
296
-
297
-
298
-
299
-
300
-
301
-
302
-
303
-
304
-
305
-
306
-
307
-
308
-
309
-
310
-
311
-
312
-
313
-
314
-
315
-
316
-
317
-
318
-
319
-
320
-
321
-
322
-
323
-
324
-
325
-
326
-
327
-
328
-
329
-
330
-
331
-
332
-
333
-
334
-
335
-
336
-
337
-
338
-
339
-
340
-
341
-
342
-
343
-
344
-
345
-
346
-
347
-
348
-
349
-
350
-
351
-
352
-
353
-
354
-
355
-
356
-
357
-
358
-
359
-
360
-
361
-
362
-
363
-
364
-
365
-
366
-
367
-
368
-
369
-
370
-
371
-
372
-
373
-
374
-
375
-
376
-
377
-
378
 |
 |

HSBC HOLDINGS PLC
Notes on the Financial Statements (continued)
272
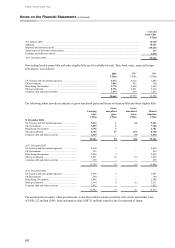
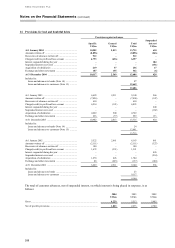
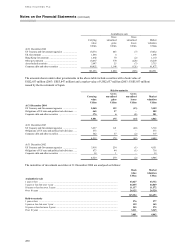
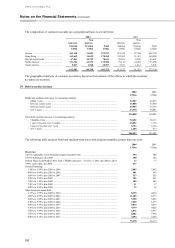
Where securities are carried at market value, and the market value is higher than cost, the difference between cost
and market value is not disclosed as it cannot be determined without unreasonable expense.
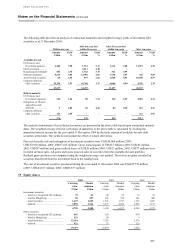
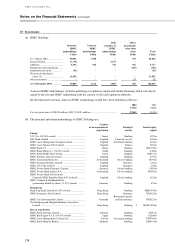
Investment securities
Cost Provisions Book value
US$m US$m US$m
At 1 January 2004 .......................................................................................... 5,738 (348) 5,390
Additions ........................................................................................................ 4,388 – 4,388
Acquisition of subsidiaries ............................................................................. 39 – 39
Disposals ........................................................................................................ (4,708) 26 (4,682)
Provisions released ......................................................................................... –7272
Provisions written off ..................................................................................... (19) 19 –
Exchange and other movements ..................................................................... (548) 50 (498)
At 31 December 2004 ................................................................................... 4,890 (181) 4,709
The following table provides an analysis of gross unrealised gains and losses as at 31 December for the past three
years:
Carrying
value
Gross
unrealised
gains
Gross
unrealised
losses
Market
valuation
US$m US$m US$m US$m
31 December 2004 ...................................................... 4,709 891 (12) 5,588
31 December 2003 ....................................................... 5,390 858 (31) 6,217
31 December 2002 ....................................................... 4,284 603 (130) 4,757
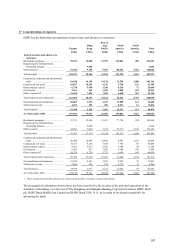
Equity investment securities include interests in money market mutual funds primarily held by HSBC Finance
Corporation for liquidity management. Proceeds from the sale of investment securities were US$5,008 million (2003:
US$6,117 million; 2002: US$1,980 million). Gross realised gains of US$365 million (2003: US$281 million; 2002:
US$215 million) and gross realised losses of US$65 million (2003: US$43 million; 2002: US$9 million) were
recorded on those sales. Realised gains and losses are computed using the weighted average cost method. There were
no gains recorded on securities transferred from the investment book to the trading book.
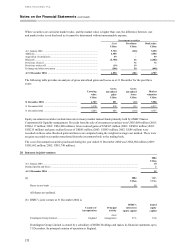
The cost of investment securities purchased during the year ended 31 December 2004 was US$4,388 million (2003:
US$5,692 million; 2002: US$1,748 million).
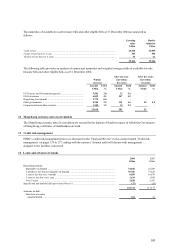
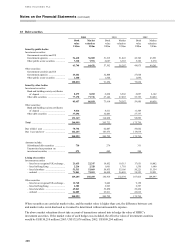
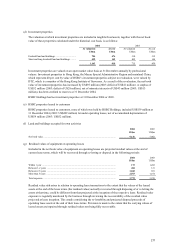
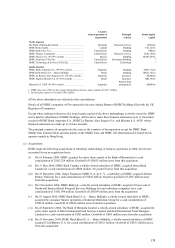
20 Interests in joint ventures
2004
US$m
At 1 January 2004 ............................................................................................................................................................. 10
Retained profits and losses ................................................................................................................................................ 2
At 31 December 2004 ...................................................................................................................................................... 12
(a) 2004 2003
US$m US$m
Shares in non-banks ...................................................................................................................... 12 10
All shares are unlisted.
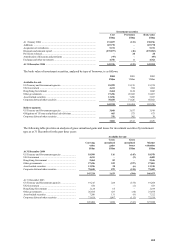
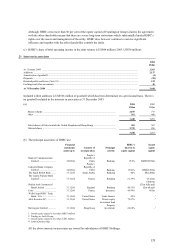
(b) HSBC’ s joint venture at 31 December 2004 is:
Country of
incorporation
Principal
activity
HSBC’s
interest in
equity capital
Issued
equity
capital
Framlington Group Limited .................................. England
Asset
management 51% £3m
Framlington Group Limited is owned by a subsidiary of HSBC Holdings and makes its financial statements up to
31 December. Its principal country of operation is England.