HSBC 2004 Annual Report Download - page 310
Download and view the complete annual report
Please find page 310 of the 2004 HSBC annual report below. You can navigate through the pages in the report by either clicking on the pages listed below, or by using the keyword search tool below to find specific information within the annual report.-
 1
1 -
2
-
3
-
4
-
5
-
6
-
7
-
8
-
9
-
10
-
11
-
12
-
13
-
14
-
15
-
16
-
17
-
18
-
19
-
20
-
21
-
22
-
23
-
24
-
25
-
26
-
27
-
28
-
29
-
30
-
31
-
32
-
33
-
34
-
35
-
36
-
37
-
38
-
39
-
40
-
41
-
42
-
43
-
44
-
45
-
46
-
47
-
48
-
49
-
50
-
51
-
52
-
53
-
54
-
55
-
56
-
57
-
58
-
59
-
60
-
61
-
62
-
63
-
64
-
65
-
66
-
67
-
68
-
69
-
70
-
71
-
72
-
73
-
74
-
75
-
76
-
77
-
78
-
79
-
80
-
81
-
82
-
83
-
84
-
85
-
86
-
87
-
88
-
89
-
90
-
91
-
92
-
93
-
94
-
95
-
96
-
97
-
98
-
99
-
100
-
101
-
102
-
103
-
104
-
105
-
106
-
107
-
108
-
109
-
110
-
111
-
112
-
113
-
114
-
115
-
116
-
117
-
118
-
119
-
120
-
121
-
122
-
123
-
124
-
125
-
126
-
127
-
128
-
129
-
130
-
131
-
132
-
133
-
134
-
135
-
136
-
137
-
138
-
139
-
140
-
141
-
142
-
143
-
144
-
145
-
146
-
147
-
148
-
149
-
150
-
151
-
152
-
153
-
154
-
155
-
156
-
157
-
158
-
159
-
160
-
161
-
162
-
163
-
164
-
165
-
166
-
167
-
168
-
169
-
170
-
171
-
172
-
173
-
174
-
175
-
176
-
177
-
178
-
179
-
180
-
181
-
182
-
183
-
184
-
185
-
186
-
187
-
188
-
189
-
190
-
191
-
192
-
193
-
194
-
195
-
196
-
197
-
198
-
199
-
200
-
201
-
202
-
203
-
204
-
205
-
206
-
207
-
208
-
209
-
210
-
211
-
212
-
213
-
214
-
215
-
216
-
217
-
218
-
219
-
220
-
221
-
222
-
223
-
224
-
225
-
226
-
227
-
228
-
229
-
230
-
231
-
232
-
233
-
234
-
235
-
236
-
237
-
238
-
239
-
240
-
241
-
242
-
243
-
244
-
245
-
246
-
247
-
248
-
249
-
250
-
251
-
252
-
253
-
254
-
255
-
256
-
257
-
258
-
259
-
260
-
261
-
262
-
263
-
264
-
265
-
266
-
267
-
268
-
269
-
270
-
271
-
272
-
273
-
274
-
275
-
276
-
277
-
278
-
279
-
280
-
281
-
282
-
283
-
284
-
285
-
286
-
287
-
288
-
289
-
290
-
291
-
292
-
293
-
294
-
295
-
296
-
297
-
298
-
299
-
 300
300 -
 301
301 -
 302
302 -
 303
303 -
 304
304 -
 305
305 -
 306
306 -
 307
307 -
 308
308 -
 309
309 -
 310
310 -
 311
311 -
 312
312 -
 313
313 -
 314
314 -
 315
315 -
 316
316 -
 317
317 -
 318
318 -
 319
319 -
 320
320 -
321
-
322
-
323
-
324
-
325
-
326
-
327
-
328
-
329
-
330
-
331
-
332
-
333
-
334
-
335
-
336
-
337
-
338
-
339
-
340
-
341
-
342
-
343
-
344
-
345
-
346
-
347
-
348
-
349
-
350
-
351
-
352
-
353
-
354
-
355
-
356
-
357
-
358
-
359
-
360
-
361
-
362
-
363
-
364
-
365
-
366
-
367
-
368
-
369
-
370
-
371
-
372
-
373
-
374
-
375
-
376
-
377
-
378
 |
 |

HSBC HOLDINGS PLC
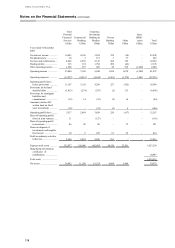
Notes on the Financial Statements (continued)
308
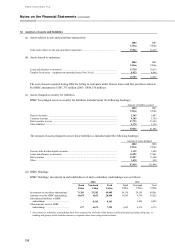
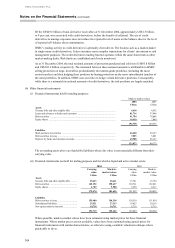
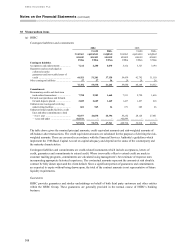
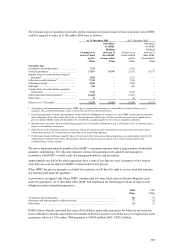
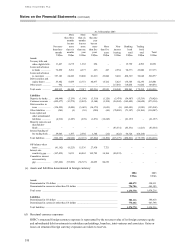
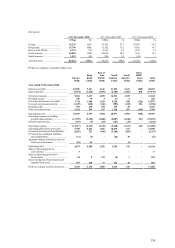
(b) Geographical concentration of contingent liabilities and commitments
HSBC has the following geographic concentrations of exposure to contingent liabilities and commitments. These
are allocated on the basis set out in Note 46:
Europe
Hong
Kong
Rest of
Asia-
Pacific
North
America
South
America Total
Contract amounts US$m US$m US$m US$m US$m US$m
Contingent liabilities
2004 ............................................ 31,915 18,844 10,621 10,275 537 72,192
2003 ............................................ 27,460 16,036 7,686 8,302 396 59,880
Commitments
2004 ............................................ 202,976 69,945 50,934 237,172 6,669 567,696
2003 ............................................ 133,475 58,098 40,029 192,779 4,383 428,764
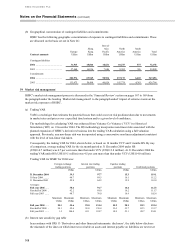
39 Market risk management
HSBC’ s market risk management process is discussed in the ‘Financial Review’ section on pages 167 to 169 from
the paragraph under the heading ‘Market risk management’ to the paragraph ended ‘impact of extreme events on the
market risk exposures of HSBC’ .
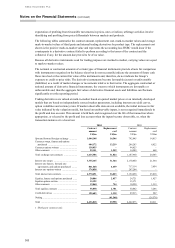
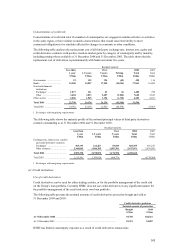
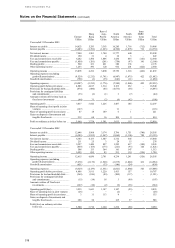
(a) Trading VAR
VAR is a technique that estimates the potential losses that could occur on risk positions taken due to movements
in market rates and prices over a specified time horizon and to a given level of confidence.
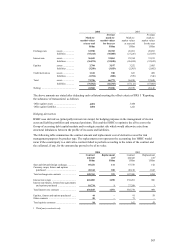
The methodology for calculating VAR was enhanced from Variance Co-Variance (‘VCV’ ) to Historical
Simulation (‘HS’ ) on 1 November 2004. The HS methodology incorporates non-linear risks associated with the
planned expansion of HSBC’ s derivatives business into the trading VAR calculation using a full valuation
approach. Previously, any non-linear risk was incorporated using a conservative non-linear adjustment consistent
with the level of non-linear risk taken.
Consequently, the trading VAR for 2004, shown below, is based on 10 months VCV and 2 months HS. By way
of comparison, average trading VAR for the six month period to 31 December 2004 under HS
(US$114.7 million) was 0.7 per cent more than that under VCV (US$113.8 million). At 31 December 2004 the
trading VAR under HS (US$119.1 million) was 4.5 per cent more than that under VCV (US$114.0 million).
Trading VAR for HSBC for 2004 was:
Foreign exchange
trading positions
Interest rate trading
positions
Equities trading
positions Combined positions
US$m US$m US$m US$m
31 December 2004 39.3 97.7 15.3 119.1
30 June 2004 ......... 40.7 89.5 16.1 112.2
31 December 2003 52.8 64.9 15.9 101.0
Averages:
Full year 2004 ...... 38.6 91.7 16.6 112.5
First half of 2004 .. 42.2 89.0 16.2 111.7
Full year 2003 ....... 48.7 70.0 16.9 102.4
Minimum Maximum Minimum Maximum Minimum Maximum Minimum Maximum
US$m US$m US$m US$m US$m US$m US$m US$m
Full year 2004 ...... 20.1 55.6 59.0 134.4 10.9 28.1 82.3 152.4
First half of 2004 .. 24.1 55.6 59.0 130.4 12.4 23.7 82.3 151.7
Full year 2003 ....... 1.2 184.4 43.1 124.7 10.9 23.1 48.7 234.1
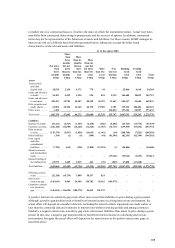
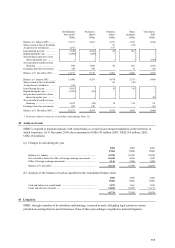
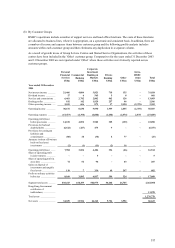
(b) Interest rate sensitivity gap table
In accordance with FRS 13 ‘Derivatives and other financial instruments: disclosure’ , the table below discloses
the mismatch of the dates on which interest receivable on assets and interest payable on liabilities are next reset