HSBC 2004 Annual Report Download - page 335
Download and view the complete annual report
Please find page 335 of the 2004 HSBC annual report below. You can navigate through the pages in the report by either clicking on the pages listed below, or by using the keyword search tool below to find specific information within the annual report.-
 1
1 -
2
-
3
-
4
-
5
-
6
-
7
-
8
-
9
-
10
-
11
-
12
-
13
-
14
-
15
-
16
-
17
-
18
-
19
-
20
-
21
-
22
-
23
-
24
-
25
-
26
-
27
-
28
-
29
-
30
-
31
-
32
-
33
-
34
-
35
-
36
-
37
-
38
-
39
-
40
-
41
-
42
-
43
-
44
-
45
-
46
-
47
-
48
-
49
-
50
-
51
-
52
-
53
-
54
-
55
-
56
-
57
-
58
-
59
-
60
-
61
-
62
-
63
-
64
-
65
-
66
-
67
-
68
-
69
-
70
-
71
-
72
-
73
-
74
-
75
-
76
-
77
-
78
-
79
-
80
-
81
-
82
-
83
-
84
-
85
-
86
-
87
-
88
-
89
-
90
-
91
-
92
-
93
-
94
-
95
-
96
-
97
-
98
-
99
-
100
-
101
-
102
-
103
-
104
-
105
-
106
-
107
-
108
-
109
-
110
-
111
-
112
-
113
-
114
-
115
-
116
-
117
-
118
-
119
-
120
-
121
-
122
-
123
-
124
-
125
-
126
-
127
-
128
-
129
-
130
-
131
-
132
-
133
-
134
-
135
-
136
-
137
-
138
-
139
-
140
-
141
-
142
-
143
-
144
-
145
-
146
-
147
-
148
-
149
-
150
-
151
-
152
-
153
-
154
-
155
-
156
-
157
-
158
-
159
-
160
-
161
-
162
-
163
-
164
-
165
-
166
-
167
-
168
-
169
-
170
-
171
-
172
-
173
-
174
-
175
-
176
-
177
-
178
-
179
-
180
-
181
-
182
-
183
-
184
-
185
-
186
-
187
-
188
-
189
-
190
-
191
-
192
-
193
-
194
-
195
-
196
-
197
-
198
-
199
-
200
-
201
-
202
-
203
-
204
-
205
-
206
-
207
-
208
-
209
-
210
-
211
-
212
-
213
-
214
-
215
-
216
-
217
-
218
-
219
-
220
-
221
-
222
-
223
-
224
-
225
-
226
-
227
-
228
-
229
-
230
-
231
-
232
-
233
-
234
-
235
-
236
-
237
-
238
-
239
-
240
-
241
-
242
-
243
-
244
-
245
-
246
-
247
-
248
-
249
-
250
-
251
-
252
-
253
-
254
-
255
-
256
-
257
-
258
-
259
-
260
-
261
-
262
-
263
-
264
-
265
-
266
-
267
-
268
-
269
-
270
-
271
-
272
-
273
-
274
-
275
-
276
-
277
-
278
-
279
-
280
-
281
-
282
-
283
-
284
-
285
-
286
-
287
-
288
-
289
-
290
-
291
-
292
-
293
-
294
-
295
-
296
-
297
-
298
-
299
-
300
-
301
-
302
-
303
-
304
-
305
-
306
-
307
-
308
-
309
-
310
-
311
-
312
-
313
-
314
-
315
-
316
-
317
-
318
-
319
-
320
-
321
-
322
-
323
-
324
-
 325
325 -
 326
326 -
 327
327 -
 328
328 -
 329
329 -
 330
330 -
 331
331 -
 332
332 -
 333
333 -
 334
334 -
 335
335 -
 336
336 -
 337
337 -
 338
338 -
 339
339 -
 340
340 -
 341
341 -
 342
342 -
 343
343 -
 344
344 -
 345
345 -
346
-
347
-
348
-
349
-
350
-
351
-
352
-
353
-
354
-
355
-
356
-
357
-
358
-
359
-
360
-
361
-
362
-
363
-
364
-
365
-
366
-
367
-
368
-
369
-
370
-
371
-
372
-
373
-
374
-
375
-
376
-
377
-
378
 |
 |

333
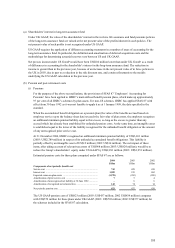
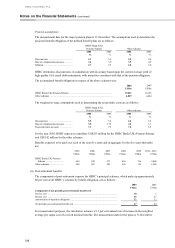
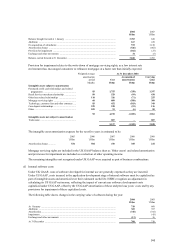
(a) Shareholders’ interest in long-term assurance fund
Under UK GAAP, the value of the shareholders’ interest in the in-force life assurance and fund pensions policies
of the long-term assurance fund are valued at the net present value of the profits inherent in such policies. The
net present value of such profits is not recognised under US GAAP.
US GAAP requires the application of different accounting treatments in a number of areas of accounting for the
long-term assurance fund. In particular, the definition and amortisation of deferred acquisition costs and the
methodology for determining actuarial reserves vary between US and UK GAAP.
Net pre-tax income under US GAAP would have been US$102 million lower than under UK GAAP, as a result
of differences in accounting for the shareholder’ s interest in the long-term assurance fund. The reduction in
income is greater than in the previous year, because of an increase in the net present value of in force policies in
the UK in 2003, due in part to a reduction in the risk discount rate, and certain refinements to the models
underlying the US GAAP calculation in the previous year.
(b) Pension and post-retirement costs
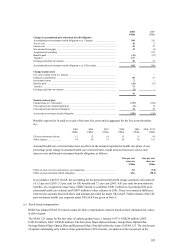
(i) Pensions
For the purpose of the above reconciliations, the provisions of SFAS 87 ‘Employers’ Accounting for
Pensions’ have been applied to HSBC’ s main defined benefit pension plans, which make up approximately
97 per cent of all HSBC’ s schemes by plan assets. For non-US schemes, HSBC has applied SFAS 87 with
effect from 30 June 1992 as it was not feasible to apply it as at 1 January 1989, the date specified in the
standard.
When the accumulated benefit obligation on a pension plan (the value of the benefits accrued based on
employee service up to the balance sheet date) exceeds the fair value of plan assets, the employer recognises
an additional minimum pension liability equal to this excess, so long as the excess is greater than any
accrual which has already been established for unfunded pension costs. At the same time, an intangible asset
is established equal to the lower of the liability recognised for the unfunded benefit obligation or the amount
of any unrecognised prior service cost.
At 31 December 2004, HSBC recognised an additional minimum pension liability of US$3,261 million
(2003: US$2,789 million) in respect of its unfunded accumulated benefit obligations. This liability is
partially offset by an intangible asset of US$12 million (2003: US$14 million). The net impact of these
items, after taking account of relevant tax assets of US$968 million (2003: US$824 million), would be to
reduce the Group’ s shareholders’ equity under US GAAP by US$2,281 million (2003: US$1,951 million).
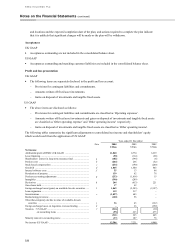
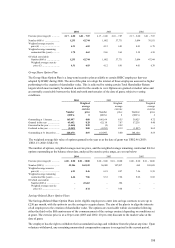
Estimated pension costs for these plans computed under SFAS 87 are as follows:
2004 2003 2002
US$m US$m US$m
Components of net periodic benefit cost
Service cost ...................................................................................... 743 429 438
Interest cost ...................................................................................... 1,209 915 862
Expected return on plan assets ......................................................... (1,278) (992) (885)
Amortisation of prior service cost .................................................... 754
Amortisation of unrecognised net liability at 30 June 1992 .............. –66
Amortisation of recognised net actuarial loss ................................... 142 74 14
Net periodic pension cost ................................................................. 823 437 439
The US GAAP pension cost of US$823 million (2003: US$437 million; 2002 US$439 million) compares
with US$579 million for these plans under UK GAAP (2003: US$703 million; 2002: US$377 million) for
the schemes included in the SFAS 87 calculation.