HSBC 2004 Annual Report Download - page 243
Download and view the complete annual report
Please find page 243 of the 2004 HSBC annual report below. You can navigate through the pages in the report by either clicking on the pages listed below, or by using the keyword search tool below to find specific information within the annual report.-
 1
1 -
2
-
3
-
4
-
5
-
6
-
7
-
8
-
9
-
10
-
11
-
12
-
13
-
14
-
15
-
16
-
17
-
18
-
19
-
20
-
21
-
22
-
23
-
24
-
25
-
26
-
27
-
28
-
29
-
30
-
31
-
32
-
33
-
34
-
35
-
36
-
37
-
38
-
39
-
40
-
41
-
42
-
43
-
44
-
45
-
46
-
47
-
48
-
49
-
50
-
51
-
52
-
53
-
54
-
55
-
56
-
57
-
58
-
59
-
60
-
61
-
62
-
63
-
64
-
65
-
66
-
67
-
68
-
69
-
70
-
71
-
72
-
73
-
74
-
75
-
76
-
77
-
78
-
79
-
80
-
81
-
82
-
83
-
84
-
85
-
86
-
87
-
88
-
89
-
90
-
91
-
92
-
93
-
94
-
95
-
96
-
97
-
98
-
99
-
100
-
101
-
102
-
103
-
104
-
105
-
106
-
107
-
108
-
109
-
110
-
111
-
112
-
113
-
114
-
115
-
116
-
117
-
118
-
119
-
120
-
121
-
122
-
123
-
124
-
125
-
126
-
127
-
128
-
129
-
130
-
131
-
132
-
133
-
134
-
135
-
136
-
137
-
138
-
139
-
140
-
141
-
142
-
143
-
144
-
145
-
146
-
147
-
148
-
149
-
150
-
151
-
152
-
153
-
154
-
155
-
156
-
157
-
158
-
159
-
160
-
161
-
162
-
163
-
164
-
165
-
166
-
167
-
168
-
169
-
170
-
171
-
172
-
173
-
174
-
175
-
176
-
177
-
178
-
179
-
180
-
181
-
182
-
183
-
184
-
185
-
186
-
187
-
188
-
189
-
190
-
191
-
192
-
193
-
194
-
195
-
196
-
197
-
198
-
199
-
200
-
201
-
202
-
203
-
204
-
205
-
206
-
207
-
208
-
209
-
210
-
211
-
212
-
213
-
214
-
215
-
216
-
217
-
218
-
219
-
220
-
221
-
222
-
223
-
224
-
225
-
226
-
227
-
228
-
229
-
230
-
231
-
232
-
 233
233 -
 234
234 -
 235
235 -
 236
236 -
 237
237 -
 238
238 -
 239
239 -
 240
240 -
 241
241 -
 242
242 -
 243
243 -
 244
244 -
 245
245 -
 246
246 -
 247
247 -
 248
248 -
 249
249 -
 250
250 -
 251
251 -
 252
252 -
 253
253 -
254
-
255
-
256
-
257
-
258
-
259
-
260
-
261
-
262
-
263
-
264
-
265
-
266
-
267
-
268
-
269
-
270
-
271
-
272
-
273
-
274
-
275
-
276
-
277
-
278
-
279
-
280
-
281
-
282
-
283
-
284
-
285
-
286
-
287
-
288
-
289
-
290
-
291
-
292
-
293
-
294
-
295
-
296
-
297
-
298
-
299
-
300
-
301
-
302
-
303
-
304
-
305
-
306
-
307
-
308
-
309
-
310
-
311
-
312
-
313
-
314
-
315
-
316
-
317
-
318
-
319
-
320
-
321
-
322
-
323
-
324
-
325
-
326
-
327
-
328
-
329
-
330
-
331
-
332
-
333
-
334
-
335
-
336
-
337
-
338
-
339
-
340
-
341
-
342
-
343
-
344
-
345
-
346
-
347
-
348
-
349
-
350
-
351
-
352
-
353
-
354
-
355
-
356
-
357
-
358
-
359
-
360
-
361
-
362
-
363
-
364
-
365
-
366
-
367
-
368
-
369
-
370
-
371
-
372
-
373
-
374
-
375
-
376
-
377
-
378
 |
 |

241
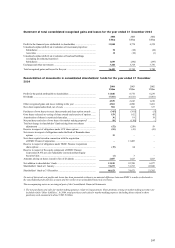
Statement of total consolidated recognised gains and losses for the year ended 31 December 2004
2004 2003 2002
US$m US$m US$m
Profit for the financial year attributable to shareholders ................................. 11,840 8,774 6,239
Unrealised surplus/(deficit) on revaluation of investment properties:
Subsidiaries ................................................................................................ 52 (28) (22)
Associates .................................................................................................. 12 (10) (1)
Unrealised surplus/(deficit) on revaluation of land and buildings
(excluding investment properties):
Subsidiaries ................................................................................................ 1,093 (292) (297)
Exchange and other movements ..................................................................... 3,404 5,318 3,781
Total recognised gains and losses for the year ............................................... 16,401 13,762 9,700
Reconciliation of movements in consolidated shareholders’ funds for the year ended 31 December
2004
2004 2003 2002
US$m US$m US$m
Profit for the period attributable to shareholders ............................................ 11,840 8,774 6,239
Dividends ....................................................................................................... (7,301) (6,532) (5,001)
4,539 2,242 1,238
Other recognised gains and losses relating to the year ................................... 4,561 4,988 3,461
New share capital subscribed, net of costs ..................................................... 581 862 337
Purchases of own shares to meet share awards and share option awards ....... (345) (301) (5)
Own shares released on vesting of share awards and exercise of options ....... 159 162 45
Amortisation of shares in restricted share plan................................................ 36 19 19
Net purchases and sales of own shares for market making purposes1 ............ 98 (138) –
Total net change in shareholders’ funds arising from own shares
adjustments ................................................................................................ (52) (258) 59
Reserve in respect of obligations under CCF share options ........................... (81) (41) (41)
Net reserve in respect of obligations under the Bank of Bermuda share
options ....................................................................................................... 15 ––
New share capital issued in connection with the acquisition
of HSBC Finance Corporation ................................................................... –13,405 –
Reserve in respect of obligations under HSBC Finance Corporation
share options .............................................................................................. (19) 84 –
Reserve in respect of the equity component of HSBC Finance
Corporation 8.875 per cent Adjustable Conversion-Rate Equity
Security Units ............................................................................................ (1) 3–
Amounts arising on shares issued in lieu of dividends ................................... 2,607 1,423 1,023
Net addition to shareholders’ funds ................................................................ 12,150 22,708 6,077
Shareholders’ funds at 1 January .................................................................... 74,473 51,765 45,688
Shareholders’ funds at 31 December .............................................................. 86,623 74,473 51,765
No note of historical cost profits and losses has been presented as there is no material difference between HSBC’s results as disclosed in
the consolidated profit and loss account and the results on an unmodified historical cost basis.
The accompanying notes are an integral part of the Consolidated Financial Statements.
1The net purchases and sales for market making purposes relate to long positions. Short positions arising in market making activities are
included within ‘Other liabilities’. In 2004, total purchases and sales for market making purposes (including those related to short
positions) each amounted to about US$5.9 billion.