HSBC 2004 Annual Report Download - page 33
Download and view the complete annual report
Please find page 33 of the 2004 HSBC annual report below. You can navigate through the pages in the report by either clicking on the pages listed below, or by using the keyword search tool below to find specific information within the annual report.-
 1
1 -
 2
2 -
 3
3 -
 4
4 -
 5
5 -
 6
6 -
 7
7 -
 8
8 -
 9
9 -
 10
10 -
 11
11 -
 12
12 -
 13
13 -
 14
14 -
 15
15 -
 16
16 -
 17
17 -
 18
18 -
 19
19 -
 20
20 -
 21
21 -
 22
22 -
 23
23 -
 24
24 -
 25
25 -
 26
26 -
 27
27 -
 28
28 -
 29
29 -
 30
30 -
 31
31 -
 32
32 -
 33
33 -
 34
34 -
 35
35 -
 36
36 -
 37
37 -
 38
38 -
 39
39 -
 40
40 -
 41
41 -
 42
42 -
 43
43 -
 44
44 -
 45
45 -
 46
46 -
 47
47 -
 48
48 -
 49
49 -
 50
50 -
 51
51 -
 52
52 -
 53
53 -
 54
54 -
 55
55 -
 56
56 -
 57
57 -
 58
58 -
 59
59 -
 60
60 -
 61
61 -
 62
62 -
 63
63 -
 64
64 -
 65
65 -
 66
66 -
 67
67 -
 68
68 -
 69
69 -
 70
70 -
 71
71 -
 72
72 -
 73
73 -
 74
74 -
 75
75 -
 76
76 -
 77
77 -
 78
78 -
 79
79 -
 80
80 -
 81
81 -
 82
82 -
 83
83 -
 84
84 -
 85
85 -
 86
86 -
 87
87 -
 88
88 -
 89
89 -
 90
90 -
 91
91 -
 92
92 -
 93
93 -
 94
94 -
 95
95 -
 96
96 -
 97
97 -
 98
98 -
 99
99 -
 100
100 -
 101
101 -
 102
102 -
 103
103 -
 104
104 -
 105
105 -
 106
106 -
 107
107 -
 108
108 -
 109
109 -
 110
110 -
 111
111 -
 112
112 -
 113
113 -
 114
114 -
 115
115 -
 116
116 -
 117
117 -
 118
118 -
 119
119 -
 120
120 -
 121
121 -
 122
122 -
 123
123 -
 124
124 -
 125
125 -
 126
126 -
 127
127 -
 128
128 -
 129
129 -
 130
130 -
 131
131 -
 132
132 -
 133
133 -
 134
134 -
 135
135 -
 136
136 -
 137
137 -
 138
138 -
 139
139 -
 140
140 -
 141
141 -
 142
142 -
 143
143 -
 144
144 -
 145
145 -
 146
146 -
 147
147 -
 148
148 -
 149
149 -
 150
150 -
 151
151 -
 152
152 -
 153
153 -
 154
154 -
 155
155 -
 156
156 -
 157
157 -
 158
158 -
 159
159 -
 160
160 -
 161
161 -
 162
162 -
 163
163 -
 164
164 -
 165
165 -
 166
166 -
 167
167 -
 168
168 -
 169
169 -
 170
170 -
 171
171 -
 172
172 -
 173
173 -
 174
174 -
 175
175 -
 176
176 -
 177
177 -
 178
178 -
 179
179 -
 180
180 -
 181
181 -
 182
182 -
 183
183 -
 184
184 -
 185
185 -
 186
186 -
 187
187 -
 188
188 -
 189
189 -
 190
190 -
 191
191 -
 192
192 -
 193
193 -
 194
194 -
 195
195 -
 196
196 -
 197
197 -
 198
198 -
 199
199 -
 200
200 -
 201
201 -
 202
202 -
 203
203 -
 204
204 -
 205
205 -
 206
206 -
 207
207 -
 208
208 -
 209
209 -
 210
210 -
 211
211 -
 212
212 -
 213
213 -
 214
214 -
 215
215 -
 216
216 -
 217
217 -
 218
218 -
 219
219 -
 220
220 -
 221
221 -
 222
222 -
 223
223 -
 224
224 -
 225
225 -
 226
226 -
 227
227 -
 228
228 -
 229
229 -
 230
230 -
 231
231 -
 232
232 -
 233
233 -
 234
234 -
 235
235 -
 236
236 -
 237
237 -
 238
238 -
 239
239 -
 240
240 -
 241
241 -
 242
242 -
 243
243 -
 244
244 -
 245
245 -
 246
246 -
 247
247 -
 248
248 -
 249
249 -
 250
250 -
 251
251 -
 252
252 -
 253
253 -
 254
254 -
 255
255 -
 256
256 -
 257
257 -
 258
258 -
 259
259 -
 260
260 -
 261
261 -
 262
262 -
 263
263 -
 264
264 -
 265
265 -
 266
266 -
 267
267 -
 268
268 -
 269
269 -
 270
270 -
 271
271 -
 272
272 -
 273
273 -
 274
274 -
 275
275 -
 276
276 -
 277
277 -
 278
278 -
 279
279 -
 280
280 -
 281
281 -
 282
282 -
 283
283 -
 284
284 -
 285
285 -
 286
286 -
 287
287 -
 288
288 -
 289
289 -
 290
290 -
 291
291 -
 292
292 -
 293
293 -
 294
294 -
 295
295 -
 296
296 -
 297
297 -
 298
298 -
 299
299 -
 300
300 -
 301
301 -
 302
302 -
 303
303 -
 304
304 -
 305
305 -
 306
306 -
 307
307 -
 308
308 -
 309
309 -
 310
310 -
 311
311 -
 312
312 -
 313
313 -
 314
314 -
 315
315 -
 316
316 -
 317
317 -
 318
318 -
 319
319 -
 320
320 -
 321
321 -
 322
322 -
 323
323 -
 324
324 -
 325
325 -
 326
326 -
 327
327 -
 328
328 -
 329
329 -
 330
330 -
 331
331 -
 332
332 -
 333
333 -
 334
334 -
 335
335 -
 336
336 -
 337
337 -
 338
338 -
 339
339 -
 340
340 -
 341
341 -
 342
342 -
 343
343 -
 344
344 -
 345
345 -
 346
346 -
 347
347 -
 348
348 -
 349
349 -
 350
350 -
 351
351 -
 352
352 -
 353
353 -
 354
354 -
 355
355 -
 356
356 -
 357
357 -
 358
358 -
 359
359 -
 360
360 -
 361
361 -
 362
362 -
 363
363 -
 364
364 -
 365
365 -
 366
366 -
 367
367 -
 368
368 -
 369
369 -
 370
370 -
 371
371 -
 372
372 -
 373
373 -
 374
374 -
 375
375 -
 376
376 -
 377
377 -
 378
378
 |
 |
31
Year ended 31 December 2004 compared
with year ended 31 December 2003
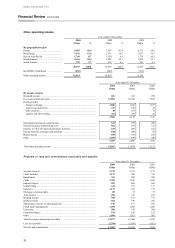
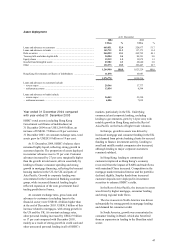
Other operating income of US$19,563 million, was
US$4,089 million, or 26 per cent, higher than in
2003. Of this increase, US$836 million was
attributable to an additional quarter from HSBC
Finance while Bank of Bermuda contributed
US$325 million. On an underlying basis, and at
constant exchange rates, growth in other operating
income was 12 per cent, driven principally by strong
growth in fee and commission income across all
operations.
Net fees and commissions rose by
US$2,699 million, or 26 per cent, with the additional
quarter of HSBC Finance and acquisitions
accounting for US$1,003 million of this increase. On
a constant currency basis, the underlying increase of
10 per cent was underpinned by lending fees from
strong growth in consumer lending in the UK and
the US, sales of investment products in Asia and a
general upturn in funds management income.
In Europe, fee income increased by
US$1,103 million, or 21 per cent, of which
US$107 million came from an extra quarter’s result
from HFC Bank and the acquisitions of Bank of
Bermuda and M&S Money. At constant currencies,
fee income rose by 8 per cent driven by strong
growth in funds under management in Private
Banking, and by the strength of both mortgage and
consumer lending, particularly in the UK where
growth in loan fees and cards income was
augmented by sales of credit protection products.
The increase in loan fee income also reflected strong
demand for commercial lending products in the UK.
Excluding the US$617 million contribution
from an additional quarter of HSBC Finance and
US$126 million from Bank Bermuda, fees and
commissions in North America increased by
US$324 million, or 4 per cent. On a comparable
basis, HSBC Finance saw strong growth in fees from
loan sales and sales of credit protection policies. In
Mexico, strong growth in the Afore pension funds
business complemented higher fee income from
credit cards, deposit services and international
remittances.
In Hong Kong, fee income rose strongly as a
rise in stock market activity sparked demand for
investment products. Unit trust, custody and broking
income all benefited from strong customer demand,
while strong growth in funds under management was
reflected in a sharp rise in discretionary mandate
fees. An improvement in consumer confidence in the
second half of the year flowed through to a rise in
cardholder spending, and credit card fee income rose
by 13 per cent.
HSBC’s operations in the Rest of Asia-Pacific
similarly benefited from an upturn in regional
financial markets, with strong sales of investment
products reflected in growth in fees from funds
under management and global custody. Further
growth came from an expansion of HSBC’s credit
card base in the region, where cards in issue grew by
929,000 or 25 per cent and from strong growth in
trade related income, particularly in the Middle East,
where the benefit of higher oil prices boosted local
economies. Overall, fee income rose by 26 per cent
at constant currencies.
In South America, net fees and commissions
were 42 per cent higher than in 2003. The bulk of the
increase came in Brazil, which benefited both from
the integration of Losango, and strong organic
growth in consumer and commercial lending.
Dealing profits of US$2,566 million were
US$388 million, or 18 per cent, higher than in 2003
with US$49 million of the increase coming from
acquisitions. Strong growth in foreign exchange and
interest rate derivatives trading offset lower income
from debt securities, while dealing losses on equity
swaps trading were offset by the related dividend
income. Customer flows were strongly ahead of
2003, driven largely by the expansion of business
capabilities during the year. This was reflected in
increases in both foreign exchange trading and
derivatives income, particularly in Europe and Hong
Kong, while retail sales of structured products
further boosted income in Hong Kong and
Singapore. However, fixed income revenues fell,
particularly in the UK, Brazil, Mexico and the US, as
movements in credit spreads adversely affected debt
trading income.
Other operating income benefited from an
expansion of HSBC’s insurance business in the UK
and Hong Kong and growth in the asset finance
business in the UK.
Year ended 31 December 2003 compared
with year ended 31 December 2002
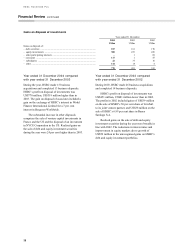
Other operating income of US$15,474 million, was
US$4,339 million, or 39 per cent, higher than in
2002. Of this increase, HSBC Finance contributed
US$1,878 million and HSBC Mexico contributed
US$599 million. On an underlying basis, and at
constant exchange rates, growth in other operating
income was 9 per cent, principally as a result of
higher dealing profits throughout HSBC’ s
operations.
