HSBC 2004 Annual Report Download - page 81
Download and view the complete annual report
Please find page 81 of the 2004 HSBC annual report below. You can navigate through the pages in the report by either clicking on the pages listed below, or by using the keyword search tool below to find specific information within the annual report.-
 1
1 -
2
-
3
-
4
-
5
-
6
-
7
-
8
-
9
-
10
-
11
-
12
-
13
-
14
-
15
-
16
-
17
-
18
-
19
-
20
-
21
-
22
-
23
-
24
-
25
-
26
-
27
-
28
-
29
-
30
-
31
-
32
-
33
-
34
-
35
-
36
-
37
-
38
-
39
-
40
-
41
-
42
-
43
-
44
-
45
-
46
-
47
-
48
-
49
-
50
-
51
-
52
-
53
-
54
-
55
-
56
-
57
-
58
-
59
-
60
-
61
-
62
-
63
-
64
-
65
-
66
-
67
-
68
-
69
-
70
-
 71
71 -
 72
72 -
 73
73 -
 74
74 -
 75
75 -
 76
76 -
 77
77 -
 78
78 -
 79
79 -
 80
80 -
 81
81 -
 82
82 -
 83
83 -
 84
84 -
 85
85 -
 86
86 -
 87
87 -
 88
88 -
 89
89 -
 90
90 -
 91
91 -
92
-
93
-
94
-
95
-
96
-
97
-
98
-
99
-
100
-
101
-
102
-
103
-
104
-
105
-
106
-
107
-
108
-
109
-
110
-
111
-
112
-
113
-
114
-
115
-
116
-
117
-
118
-
119
-
120
-
121
-
122
-
123
-
124
-
125
-
126
-
127
-
128
-
129
-
130
-
131
-
132
-
133
-
134
-
135
-
136
-
137
-
138
-
139
-
140
-
141
-
142
-
143
-
144
-
145
-
146
-
147
-
148
-
149
-
150
-
151
-
152
-
153
-
154
-
155
-
156
-
157
-
158
-
159
-
160
-
161
-
162
-
163
-
164
-
165
-
166
-
167
-
168
-
169
-
170
-
171
-
172
-
173
-
174
-
175
-
176
-
177
-
178
-
179
-
180
-
181
-
182
-
183
-
184
-
185
-
186
-
187
-
188
-
189
-
190
-
191
-
192
-
193
-
194
-
195
-
196
-
197
-
198
-
199
-
200
-
201
-
202
-
203
-
204
-
205
-
206
-
207
-
208
-
209
-
210
-
211
-
212
-
213
-
214
-
215
-
216
-
217
-
218
-
219
-
220
-
221
-
222
-
223
-
224
-
225
-
226
-
227
-
228
-
229
-
230
-
231
-
232
-
233
-
234
-
235
-
236
-
237
-
238
-
239
-
240
-
241
-
242
-
243
-
244
-
245
-
246
-
247
-
248
-
249
-
250
-
251
-
252
-
253
-
254
-
255
-
256
-
257
-
258
-
259
-
260
-
261
-
262
-
263
-
264
-
265
-
266
-
267
-
268
-
269
-
270
-
271
-
272
-
273
-
274
-
275
-
276
-
277
-
278
-
279
-
280
-
281
-
282
-
283
-
284
-
285
-
286
-
287
-
288
-
289
-
290
-
291
-
292
-
293
-
294
-
295
-
296
-
297
-
298
-
299
-
300
-
301
-
302
-
303
-
304
-
305
-
306
-
307
-
308
-
309
-
310
-
311
-
312
-
313
-
314
-
315
-
316
-
317
-
318
-
319
-
320
-
321
-
322
-
323
-
324
-
325
-
326
-
327
-
328
-
329
-
330
-
331
-
332
-
333
-
334
-
335
-
336
-
337
-
338
-
339
-
340
-
341
-
342
-
343
-
344
-
345
-
346
-
347
-
348
-
349
-
350
-
351
-
352
-
353
-
354
-
355
-
356
-
357
-
358
-
359
-
360
-
361
-
362
-
363
-
364
-
365
-
366
-
367
-
368
-
369
-
370
-
371
-
372
-
373
-
374
-
375
-
376
-
377
-
378
 |
 |
79
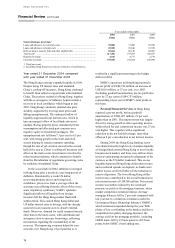
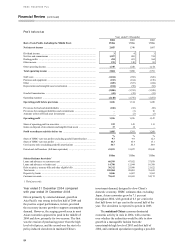
Overall, credit quality remained stable reflecting
improved economic conditions in the latter part of
the year. There was a lower release in general
provisions in 2003 as last year benefited from a
reduction in latent losses.
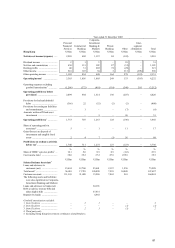
Corporate, Investment Banking and Markets
reported pre-tax profit, before amortisation of
goodwill, of US$1,275 million, 4 per cent higher
than in 2002. Exceptional Global Markets
performance was partly offset by a shift from net
recovery to net charge for bad and doubtful debts.
Net interest income of US$1,157 million was
broadly in line with last year. Reduced corporate
lending spreads, which remained under pressure
throughout the year, and weak loan demand, were
mitigated by a strong Global Markets performance.
Global Markets benefited from successful interest
rate positioning and an increased value of funds was
switched to debt securities from interbank
placements in order to enhance yields.
Other operating income grew strongly to
US$648 million, an increase of US$184 million or
40 per cent. This was achieved through a significant
increase in dealing profits to US$205 million. HSBC
significantly expanded its derivatives capabilities
and higher income was earned from both successful
positioning and a growing demand from corporate
customers for structured tailored solutions. Increased
sales of structured transactions, offering yield
enhancement products to retail clients, generated
further revenue. Debt securities trading achieved a
strong turnaround in income during the year, as
losses caused by widening credit spreads in 2002 did
not recur. Foreign exchange profits rose compared
with 2002, with a significant increase in corporate
sales. Trading profits were generated as the bank
took advantage of US dollar volatility, and the
general weakening of the US dollar during the year.
This was partly offset by lower Corporate and
Investment Banking fees and commissions,
reflecting a decrease in income from credit facilities.
Operating expenses, before goodwill
amortisation, increased by 5 per cent to
US$491 million, with the significant increase in
Global Markets’ profitability reflected in higher
performance-related staff costs.
There was a net charge for bad and doubtful
debts of US$52 million compared with a release of
US$68 million in 2002. This was primarily due to
new specific provisions raised against two corporate
accounts.
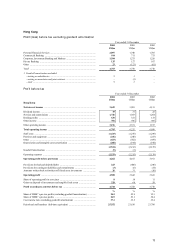
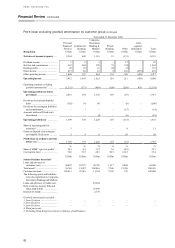
HSBC’s Private Banking activities in Hong
Kong reported pre-tax profit, before goodwill
amortisation, of US$127 million, an increase of
19 per cent over 2002. Funds under management
grew by 12 per cent to US$56 billion, benefiting
from US$7 billion of net new funds as clients moved
away from liquid positions into the investment
markets.
Net interest income declined by US$7 million,
or 8 per cent, to US$84 million. Lower margins from
free funds and the investment portfolio reflected
falling interest rates while the flattening of the yield
curve during the year meant that the significant
income earned on longer dated assets in 2002 was
not repeated. This more than offset the impact of an
increase in lending balances as clients borrowed on
margin against their investments to reinvest in higher
returning securities.
A general improvement in investment markets
in the second half of the year saw greater client
activity across a range of products. Brokerage, trust
services and safekeeping all benefited from the
upturn in the markets, and associated fee and
commission income increased by 19 per cent to
US$87 million. Greater market activity also
stimulated higher sales of tailored structured
products for clients and higher volumes of debt
securities and derivatives transactions, resulting in a
68 per cent increase in dealing profits. Overall, other
operating income increased by 31 per cent to
US$164 million.
Total operating expenses grew by US$9 million
or 8 per cent, reflecting a rise in headcount to
support increased client activity and the migration of
regional support from Singapore to Hong Kong
during the year. There was also higher performance-
related remuneration in line with increased profits.