HSBC 2004 Annual Report Download - page 272
Download and view the complete annual report
Please find page 272 of the 2004 HSBC annual report below. You can navigate through the pages in the report by either clicking on the pages listed below, or by using the keyword search tool below to find specific information within the annual report.-
 1
1 -
2
-
3
-
4
-
5
-
6
-
7
-
8
-
9
-
10
-
11
-
12
-
13
-
14
-
15
-
16
-
17
-
18
-
19
-
20
-
21
-
22
-
23
-
24
-
25
-
26
-
27
-
28
-
29
-
30
-
31
-
32
-
33
-
34
-
35
-
36
-
37
-
38
-
39
-
40
-
41
-
42
-
43
-
44
-
45
-
46
-
47
-
48
-
49
-
50
-
51
-
52
-
53
-
54
-
55
-
56
-
57
-
58
-
59
-
60
-
61
-
62
-
63
-
64
-
65
-
66
-
67
-
68
-
69
-
70
-
71
-
72
-
73
-
74
-
75
-
76
-
77
-
78
-
79
-
80
-
81
-
82
-
83
-
84
-
85
-
86
-
87
-
88
-
89
-
90
-
91
-
92
-
93
-
94
-
95
-
96
-
97
-
98
-
99
-
100
-
101
-
102
-
103
-
104
-
105
-
106
-
107
-
108
-
109
-
110
-
111
-
112
-
113
-
114
-
115
-
116
-
117
-
118
-
119
-
120
-
121
-
122
-
123
-
124
-
125
-
126
-
127
-
128
-
129
-
130
-
131
-
132
-
133
-
134
-
135
-
136
-
137
-
138
-
139
-
140
-
141
-
142
-
143
-
144
-
145
-
146
-
147
-
148
-
149
-
150
-
151
-
152
-
153
-
154
-
155
-
156
-
157
-
158
-
159
-
160
-
161
-
162
-
163
-
164
-
165
-
166
-
167
-
168
-
169
-
170
-
171
-
172
-
173
-
174
-
175
-
176
-
177
-
178
-
179
-
180
-
181
-
182
-
183
-
184
-
185
-
186
-
187
-
188
-
189
-
190
-
191
-
192
-
193
-
194
-
195
-
196
-
197
-
198
-
199
-
200
-
201
-
202
-
203
-
204
-
205
-
206
-
207
-
208
-
209
-
210
-
211
-
212
-
213
-
214
-
215
-
216
-
217
-
218
-
219
-
220
-
221
-
222
-
223
-
224
-
225
-
226
-
227
-
228
-
229
-
230
-
231
-
232
-
233
-
234
-
235
-
236
-
237
-
238
-
239
-
240
-
241
-
242
-
243
-
244
-
245
-
246
-
247
-
248
-
249
-
250
-
251
-
252
-
253
-
254
-
255
-
256
-
257
-
258
-
259
-
260
-
261
-
 262
262 -
 263
263 -
 264
264 -
 265
265 -
 266
266 -
 267
267 -
 268
268 -
 269
269 -
 270
270 -
 271
271 -
 272
272 -
 273
273 -
 274
274 -
 275
275 -
 276
276 -
 277
277 -
 278
278 -
 279
279 -
 280
280 -
 281
281 -
 282
282 -
283
-
284
-
285
-
286
-
287
-
288
-
289
-
290
-
291
-
292
-
293
-
294
-
295
-
296
-
297
-
298
-
299
-
300
-
301
-
302
-
303
-
304
-
305
-
306
-
307
-
308
-
309
-
310
-
311
-
312
-
313
-
314
-
315
-
316
-
317
-
318
-
319
-
320
-
321
-
322
-
323
-
324
-
325
-
326
-
327
-
328
-
329
-
330
-
331
-
332
-
333
-
334
-
335
-
336
-
337
-
338
-
339
-
340
-
341
-
342
-
343
-
344
-
345
-
346
-
347
-
348
-
349
-
350
-
351
-
352
-
353
-
354
-
355
-
356
-
357
-
358
-
359
-
360
-
361
-
362
-
363
-
364
-
365
-
366
-
367
-
368
-
369
-
370
-
371
-
372
-
373
-
374
-
375
-
376
-
377
-
378
 |
 |

HSBC HOLDINGS PLC
Notes on the Financial Statements (continued)
270
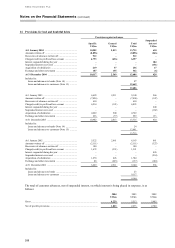
Available-for-sale
Carrying
value
Gross
unrealised
gains
Gross
unrealised
losses
Market
valuation
US$m US$m US$m US$m
At 31 December 2002
US Treasury and Government agencies ....................... 18,574 445 (7) 19,012
UK Government ........................................................... 1,064 4 – 1,068
Hong Kong Government .............................................. 1,042 70 (2) 1,110
Other governments ....................................................... 18,067 370 (228) 18,209
Asset-backed securities ................................................ 3,697 25 (7) 3,715
Corporate debt and other securities .............................. 60,852 1,146 (121) 61,877
103,296 2,060 (365) 104,991
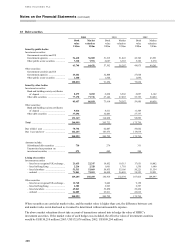
The amounts shown under other governments in the above table include securities with a book value of
US$2,653 million (2003: US$5,847 million) and a market value of US$2,657 million (2003: US$5,853 million)
issued by the Government of Japan.
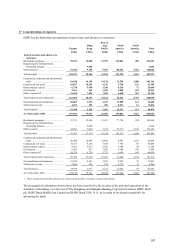
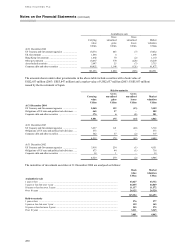
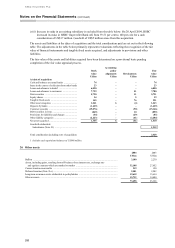
Held-to-maturity
Carrying
value
Gross
unrealised
gains
Gross
unrealised
losses
Market
valuation
US$m US$m US$m US$m
At 31 December 2004
US Treasury and Government agencies ....................... 3,040 132 (13) 3,159
Obligations of US state and political sub-divisions ...... 465 37 – 502
Corporate debt and other securities .............................. 376 6 (1) 381
3,881 175 (14) 4,042
At 31 December 2003
US Treasury and Government agencies ....................... 3,637 121 (40) 3,718
Obligations of US state and political sub-divisions ...... 573 – – 573
Corporate debt and other securities ............................... 302 57 (2) 357
4,512 178 (42) 4,648
At 31 December 2002
US Treasury and Government agencies ....................... 3,918 234 (1) 4,151
Obligations of US state and political sub-divisions ...... 673 44 (1) 716
Corporate debt and other securities .............................. 38 1 – 39
4,629 279 (2) 4,906
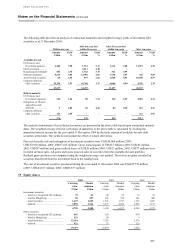
The maturities of investment securities at 31 December 2004 are analysed as follows:
Book
value
Market
valuation
US$m US$m
Available-for-sale
1 year or less ................................................................................................................................... 43,627 43,712
5 years or less but over 1 year ......................................................................................................... 64,435 64,849
10 years or less but over 5 years ...................................................................................................... 11,137 11,572
Over 10 years .................................................................................................................................. 26,125 26,320
145,324 146,453
Held-to-maturity
1 year or less ................................................................................................................................... 276 277
5 years or less but over 1 year ......................................................................................................... 139 145
10 years or less but over 5 years ...................................................................................................... 255 275
Over 10 years .................................................................................................................................. 3,211 3,345
3,881 4,042