HSBC 2004 Annual Report Download - page 270
Download and view the complete annual report
Please find page 270 of the 2004 HSBC annual report below. You can navigate through the pages in the report by either clicking on the pages listed below, or by using the keyword search tool below to find specific information within the annual report.-
 1
1 -
2
-
3
-
4
-
5
-
6
-
7
-
8
-
9
-
10
-
11
-
12
-
13
-
14
-
15
-
16
-
17
-
18
-
19
-
20
-
21
-
22
-
23
-
24
-
25
-
26
-
27
-
28
-
29
-
30
-
31
-
32
-
33
-
34
-
35
-
36
-
37
-
38
-
39
-
40
-
41
-
42
-
43
-
44
-
45
-
46
-
47
-
48
-
49
-
50
-
51
-
52
-
53
-
54
-
55
-
56
-
57
-
58
-
59
-
60
-
61
-
62
-
63
-
64
-
65
-
66
-
67
-
68
-
69
-
70
-
71
-
72
-
73
-
74
-
75
-
76
-
77
-
78
-
79
-
80
-
81
-
82
-
83
-
84
-
85
-
86
-
87
-
88
-
89
-
90
-
91
-
92
-
93
-
94
-
95
-
96
-
97
-
98
-
99
-
100
-
101
-
102
-
103
-
104
-
105
-
106
-
107
-
108
-
109
-
110
-
111
-
112
-
113
-
114
-
115
-
116
-
117
-
118
-
119
-
120
-
121
-
122
-
123
-
124
-
125
-
126
-
127
-
128
-
129
-
130
-
131
-
132
-
133
-
134
-
135
-
136
-
137
-
138
-
139
-
140
-
141
-
142
-
143
-
144
-
145
-
146
-
147
-
148
-
149
-
150
-
151
-
152
-
153
-
154
-
155
-
156
-
157
-
158
-
159
-
160
-
161
-
162
-
163
-
164
-
165
-
166
-
167
-
168
-
169
-
170
-
171
-
172
-
173
-
174
-
175
-
176
-
177
-
178
-
179
-
180
-
181
-
182
-
183
-
184
-
185
-
186
-
187
-
188
-
189
-
190
-
191
-
192
-
193
-
194
-
195
-
196
-
197
-
198
-
199
-
200
-
201
-
202
-
203
-
204
-
205
-
206
-
207
-
208
-
209
-
210
-
211
-
212
-
213
-
214
-
215
-
216
-
217
-
218
-
219
-
220
-
221
-
222
-
223
-
224
-
225
-
226
-
227
-
228
-
229
-
230
-
231
-
232
-
233
-
234
-
235
-
236
-
237
-
238
-
239
-
240
-
241
-
242
-
243
-
244
-
245
-
246
-
247
-
248
-
249
-
250
-
251
-
252
-
253
-
254
-
255
-
256
-
257
-
258
-
259
-
 260
260 -
 261
261 -
 262
262 -
 263
263 -
 264
264 -
 265
265 -
 266
266 -
 267
267 -
 268
268 -
 269
269 -
 270
270 -
 271
271 -
 272
272 -
 273
273 -
 274
274 -
 275
275 -
 276
276 -
 277
277 -
 278
278 -
 279
279 -
 280
280 -
281
-
282
-
283
-
284
-
285
-
286
-
287
-
288
-
289
-
290
-
291
-
292
-
293
-
294
-
295
-
296
-
297
-
298
-
299
-
300
-
301
-
302
-
303
-
304
-
305
-
306
-
307
-
308
-
309
-
310
-
311
-
312
-
313
-
314
-
315
-
316
-
317
-
318
-
319
-
320
-
321
-
322
-
323
-
324
-
325
-
326
-
327
-
328
-
329
-
330
-
331
-
332
-
333
-
334
-
335
-
336
-
337
-
338
-
339
-
340
-
341
-
342
-
343
-
344
-
345
-
346
-
347
-
348
-
349
-
350
-
351
-
352
-
353
-
354
-
355
-
356
-
357
-
358
-
359
-
360
-
361
-
362
-
363
-
364
-
365
-
366
-
367
-
368
-
369
-
370
-
371
-
372
-
373
-
374
-
375
-
376
-
377
-
378
 |
 |

HSBC HOLDINGS PLC
Notes on the Financial Statements (continued)
268
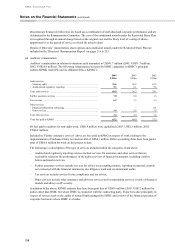
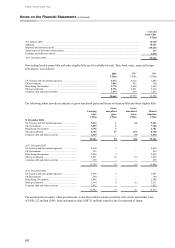
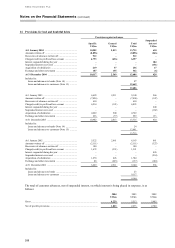
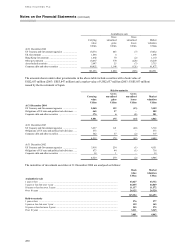
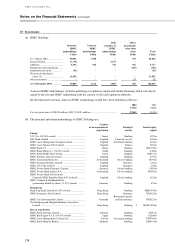
18 Debt securities
2004 2003 2002
Book
value
Market
valuation
Book
value
Market
valuation
Book
value
Market
valuation
US$m US$m US$m US$m US$m US$m
Issued by public bodies
Investment securities:
Government securities and US
Government agencies ............................ 56,410 56,885 51,215 51,822 42,706 43,591
Other public sector securities ................ 7,338 7,591 6,087 6,385 5,369 5,670
63,748 64,476 57,302 58,207 48,075 49,261
Other securities:
Government securities and US
Government agencies ............................ 43,642 32,848 27,664
Other public sector securities ................ 1,440 1,504 1,095
108,830 91,654 76,834
Issued by other bodies
Investment securities:
Bank and building society certificates
of deposit .......................................... 8,279 8,283 6,468 6,502 6,097 6,142
Other debt securities ............................. 77,178 77,736 67,146 67,885 53,753 54,494
85,457 86,019 73,614 74,387 59,850 60,636
Other securities:
Bank and building society certificates
of deposit .......................................... 9,016 8,411 11,309
Other debt securities ............................. 37,696 32,043 27,737
132,169 114,068 98,896
Total ........................................................ 240,999 205,722 175,730
Due within 1 year ..................................... 78,754 62,047 56,052
Due 1 year and over ................................. 162,245 143,675 119,678
240,999 205,722 175,730
Amounts include:
Subordinated debt securities ................. 730 276 311
Unamortised net premium on
investment securities ............................. 573 485 594
Listing of securities
Investment securities
– listed on a recognised UK exchange .. 21,635 22,247 18,852 19,315 17,651 18,082
– listed in Hong Kong .......................... 2,216 2,328 1,601 1,710 1,530 1,640
– listed elsewhere ................................. 53,513 53,869 54,435 55,166 50,221 51,354
– unlisted .............................................. 71,841 72,051 56,028 56,403 38,523 38,821
149,205 150,495 130,916 132,594 107,925 109,897
Other securities
– listed on a recognised UK exchange .. 12,760 9,442 9,158
– listed in Hong Kong .......................... 2,302 2,503 2,397
– listed elsewhere ................................. 49,843 39,850 29,434
– unlisted .............................................. 26,889 23,011 26,816
240,999 205,722 175,730
Where securities are carried at market value, and the market value is higher than cost, the difference between cost
and market value is not disclosed as it cannot be determined without unreasonable expense.
The above market valuations do not take account of transactions entered into to hedge the value of HSBC’ s
investment securities. If the market value of such hedges was included, the effective value of investment securities
would be US$150,210 million (2003: US$132,076 million, 2002: US$109,204 million).