HSBC 2004 Annual Report Download - page 257
Download and view the complete annual report
Please find page 257 of the 2004 HSBC annual report below. You can navigate through the pages in the report by either clicking on the pages listed below, or by using the keyword search tool below to find specific information within the annual report.-
 1
1 -
2
-
3
-
4
-
5
-
6
-
7
-
8
-
9
-
10
-
11
-
12
-
13
-
14
-
15
-
16
-
17
-
18
-
19
-
20
-
21
-
22
-
23
-
24
-
25
-
26
-
27
-
28
-
29
-
30
-
31
-
32
-
33
-
34
-
35
-
36
-
37
-
38
-
39
-
40
-
41
-
42
-
43
-
44
-
45
-
46
-
47
-
48
-
49
-
50
-
51
-
52
-
53
-
54
-
55
-
56
-
57
-
58
-
59
-
60
-
61
-
62
-
63
-
64
-
65
-
66
-
67
-
68
-
69
-
70
-
71
-
72
-
73
-
74
-
75
-
76
-
77
-
78
-
79
-
80
-
81
-
82
-
83
-
84
-
85
-
86
-
87
-
88
-
89
-
90
-
91
-
92
-
93
-
94
-
95
-
96
-
97
-
98
-
99
-
100
-
101
-
102
-
103
-
104
-
105
-
106
-
107
-
108
-
109
-
110
-
111
-
112
-
113
-
114
-
115
-
116
-
117
-
118
-
119
-
120
-
121
-
122
-
123
-
124
-
125
-
126
-
127
-
128
-
129
-
130
-
131
-
132
-
133
-
134
-
135
-
136
-
137
-
138
-
139
-
140
-
141
-
142
-
143
-
144
-
145
-
146
-
147
-
148
-
149
-
150
-
151
-
152
-
153
-
154
-
155
-
156
-
157
-
158
-
159
-
160
-
161
-
162
-
163
-
164
-
165
-
166
-
167
-
168
-
169
-
170
-
171
-
172
-
173
-
174
-
175
-
176
-
177
-
178
-
179
-
180
-
181
-
182
-
183
-
184
-
185
-
186
-
187
-
188
-
189
-
190
-
191
-
192
-
193
-
194
-
195
-
196
-
197
-
198
-
199
-
200
-
201
-
202
-
203
-
204
-
205
-
206
-
207
-
208
-
209
-
210
-
211
-
212
-
213
-
214
-
215
-
216
-
217
-
218
-
219
-
220
-
221
-
222
-
223
-
224
-
225
-
226
-
227
-
228
-
229
-
230
-
231
-
232
-
233
-
234
-
235
-
236
-
237
-
238
-
239
-
240
-
241
-
242
-
243
-
244
-
245
-
246
-
 247
247 -
 248
248 -
 249
249 -
 250
250 -
 251
251 -
 252
252 -
 253
253 -
 254
254 -
 255
255 -
 256
256 -
 257
257 -
 258
258 -
 259
259 -
 260
260 -
 261
261 -
 262
262 -
 263
263 -
 264
264 -
 265
265 -
 266
266 -
 267
267 -
268
-
269
-
270
-
271
-
272
-
273
-
274
-
275
-
276
-
277
-
278
-
279
-
280
-
281
-
282
-
283
-
284
-
285
-
286
-
287
-
288
-
289
-
290
-
291
-
292
-
293
-
294
-
295
-
296
-
297
-
298
-
299
-
300
-
301
-
302
-
303
-
304
-
305
-
306
-
307
-
308
-
309
-
310
-
311
-
312
-
313
-
314
-
315
-
316
-
317
-
318
-
319
-
320
-
321
-
322
-
323
-
324
-
325
-
326
-
327
-
328
-
329
-
330
-
331
-
332
-
333
-
334
-
335
-
336
-
337
-
338
-
339
-
340
-
341
-
342
-
343
-
344
-
345
-
346
-
347
-
348
-
349
-
350
-
351
-
352
-
353
-
354
-
355
-
356
-
357
-
358
-
359
-
360
-
361
-
362
-
363
-
364
-
365
-
366
-
367
-
368
-
369
-
370
-
371
-
372
-
373
-
374
-
375
-
376
-
377
-
378
 |
 |

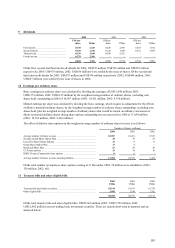
255
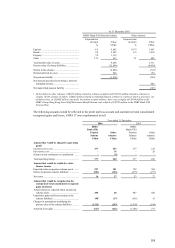
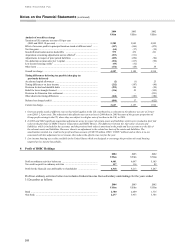
At 31 December 2002
HSBC Bank (UK) Pension Scheme Other schemes
Expected rate
of return Value
Expected rate
of return Value
%US$m %US$m
Equities ............................................................. 8.5 5,682 10.75 1,491
Bonds ................................................................ 5.0 2,032 6.3 1,418
Property ............................................................. 7.0 1,139 – –
Other ................................................................. 3.75 415 3.1 402
Total market value of assets .............................. 9,268 3,311
Present value of scheme liabilities ..................... (12,094) (4,030)
Deficit in the schemes ....................................... (2,826) (719)1
Related deferred tax asset .................................. 848 150
Net pension liability .......................................... (1,978) (569)
Net amounts provided in the balance sheet for
unfunded schemes ......................................... 402
Net unprovided pension liability ....................... (167)
1Of the deficit in other schemes, US$832 million related to schemes in deficit and US$113 million related to schemes in
surplus. Of the schemes in deficit, US$442 million related to unfunded pension schemes in respect of which a provision, net
of deferred tax, of US$402 million was made. In relation to main schemes, there was a surplus of US$86 million in the
HSBC Group Hong Kong Local Staff Retirement Benefit Scheme and a deficit of US$79 million in the HSBC Bank USA
Pension Plan.
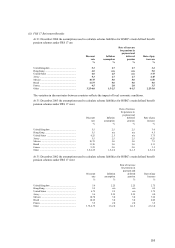
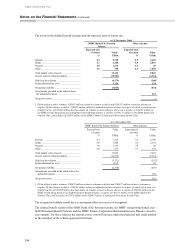
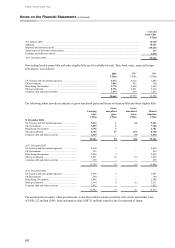
The following amounts would be reflected in the profit and loss account and statement of total consolidated
recognised gains and losses, if FRS 17 were implemented in full.
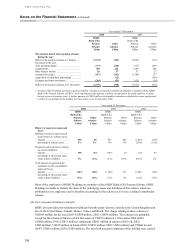
Year ended 31 December
2004 2003
HSBC
Bank (UK)
Pension
Scheme
Other
schemes
HSBC
Bank (UK)
Pension
Scheme
Other
schemes
US$m US$m US$m US$m
Amount that would be charged to operating
profit
Current service cost ........................................... 377 253 277 215
Past service cost ................................................ –16 –28
(Gains) on any settlements or curtailments ....... –(9) ––
Total operating charge ....................................... 377 260 277 243
Amount that would be credited to other
finance income
Expected return on pension scheme assets ........ 927 381 728 304
Interest on pension scheme liabilities ................ (901) (324) (675) (277)
Net return .......................................................... 26 57 53 27
Amount that would be recognised in the
statement of total consolidated recognised
gains and losses
Actual return less expected return on pension
scheme assets ................................................. 498 68 987 442
Experience gains and losses arising on the
scheme liabilities............................................ 1981(37) (195) 19
Changes in assumptions underlying the
present value of the scheme liabilities ........... (1,323) (293) (1,978) (184)
Actuarial (loss)/gain .......................................... (627) (262) (1,186) 277