DHL 2010 Annual Report Download - page 5
Download and view the complete annual report
Please find page 5 of the 2010 DHL annual report below. You can navigate through the pages in the report by either clicking on the pages listed below, or by using the keyword search tool below to find specific information within the annual report.-
 1
1 -
 2
2 -
 3
3 -
 4
4 -
 5
5 -
 6
6 -
 7
7 -
 8
8 -
 9
9 -
 10
10 -
 11
11 -
 12
12 -
 13
13 -
 14
14 -
 15
15 -
 16
16 -
17
-
18
-
19
-
20
-
21
-
22
-
23
-
24
-
25
-
26
-
27
-
28
-
29
-
30
-
31
-
32
-
33
-
34
-
35
-
36
-
37
-
38
-
39
-
40
-
41
-
42
-
43
-
44
-
45
-
46
-
47
-
48
-
49
-
50
-
51
-
52
-
53
-
54
-
55
-
56
-
57
-
58
-
59
-
60
-
61
-
62
-
63
-
64
-
65
-
66
-
67
-
68
-
69
-
70
-
71
-
72
-
73
-
74
-
75
-
76
-
77
-
78
-
79
-
80
-
81
-
82
-
83
-
84
-
85
-
86
-
87
-
88
-
89
-
90
-
91
-
92
-
93
-
94
-
95
-
96
-
97
-
98
-
99
-
100
-
101
-
102
-
103
-
104
-
105
-
106
-
107
-
108
-
109
-
110
-
111
-
112
-
113
-
114
-
115
-
116
-
117
-
118
-
119
-
120
-
121
-
122
-
123
-
124
-
125
-
126
-
127
-
128
-
129
-
130
-
131
-
132
-
133
-
134
-
135
-
136
-
137
-
138
-
139
-
140
-
141
-
142
-
143
-
144
-
145
-
146
-
147
-
148
-
149
-
150
-
151
-
152
-
153
-
154
-
155
-
156
-
157
-
158
-
159
-
160
-
161
-
162
-
163
-
164
-
165
-
166
-
167
-
168
-
169
-
170
-
171
-
172
-
173
-
174
-
175
-
176
-
177
-
178
-
179
-
180
-
181
-
182
-
183
-
184
-
185
-
186
-
187
-
188
-
189
-
190
-
191
-
192
-
193
-
194
-
195
-
196
-
197
-
198
-
199
-
200
-
201
-
202
-
203
-
204
-
205
-
206
-
207
-
208
-
209
-
210
-
211
-
212
-
213
-
214
-
215
-
216
-
217
-
218
-
219
-
220
-
221
-
222
-
223
-
224
-
225
-
226
-
227
-
228
-
229
-
230
-
231
-
232
-
233
-
234
-
235
-
236
-
237
-
238
-
239
-
240
-
241
-
242
-
243
-
244
-
245
-
246
-
247
-
248
-
249
-
250
-
251
-
252
 |
 |

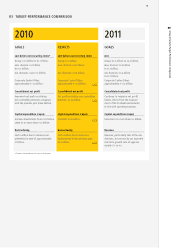
03 TARGET-PERFORMANCE COMPARISON
III
GOALS
before non-recurring items1)
Group: . billion to . billion.
division: . billion
to . billion.
divisions: over . billion.
Corporate Center / Other:
approximately – . billion.
Consolidated net profi t
Improved net profit excluding
non-controlling interests compared
withthe previous year ( million).
Capital expenditure (capex)
Increase investments from . billion
to no more than . billion.
Restructuring
Cash outfl ow due to measures im-
plemented in of approximately
billion.
RESULTS
before non-recurring items
Group: . billion.
division: . billion.
divisions: . billion.
Corporate Center / Other:
approximately – . billion.
Consolidated net profi t
Net profi t excluding non-controlling
interests:
. billion.
Capital expenditure (capex)
Invested: . billion.
Restructuring
Cash outfl ow due to measures
implemented in the previous year:
. billion.
GOALS
Group: . billion to . billion.
division: . billion
to . billion.
divisions: . billion
to . billion.
Corporate Center / Other:
approximately – . billion.
Consolidated net profi t
Continue to improve net profit
beforeeffects from the measure-
mentof thePostbank instruments,
inline with operating business.
Capital expenditure (capex)
Increase to no more than . billion.
Revenue
Revenue, particularly that of the
divisions, to increase by our expected
mid-term growth rate of approxi-
mately to .
Forecast increased over the course of the year.
Group Structure / Target-Performance Comparison