Xcel Energy 2005 Annual Report Download - page 82
Download and view the complete annual report
Please find page 82 of the 2005 Xcel Energy annual report below. You can navigate through the pages in the report by either clicking on the pages listed below, or by using the keyword search tool below to find specific information within the annual report.-
 1
1 -
2
-
3
-
4
-
5
-
6
-
7
-
8
-
9
-
10
-
11
-
12
-
13
-
14
-
15
-
16
-
17
-
18
-
19
-
20
-
21
-
22
-
23
-
24
-
25
-
26
-
27
-
28
-
29
-
30
-
31
-
32
-
33
-
34
-
35
-
36
-
37
-
38
-
39
-
40
-
41
-
42
-
43
-
44
-
45
-
46
-
47
-
48
-
49
-
50
-
51
-
52
-
53
-
54
-
55
-
56
-
57
-
58
-
59
-
60
-
61
-
62
-
63
-
64
-
65
-
66
-
67
-
68
-
69
-
70
-
71
-
 72
72 -
 73
73 -
 74
74 -
 75
75 -
 76
76 -
 77
77 -
 78
78 -
 79
79 -
 80
80 -
 81
81 -
 82
82 -
 83
83 -
 84
84 -
 85
85 -
 86
86 -
 87
87 -
 88
88
 |
 |

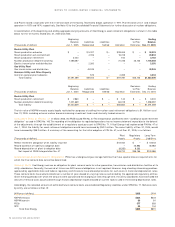
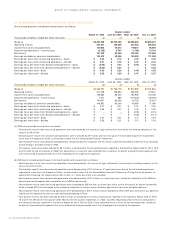
16. REGULATORY ASSETS AND LIABILITIES
Xcel Energy’s regulated businesses prepare their Consolidated Financial Statements in accordance with the provisions of SFAS No. 71, as
discussed in Note 1 to the Consolidated Financial Statements. Under SFAS No. 71, regulatory assets and liabilities can be created for amounts
that regulators may allow to be collected, or may require to be paid back to customers in future electric and natural gas rates. Any portion
of Xcel Energy’s business that is not regulated cannot use SFAS No. 71 accounting. If changes in the utility industry or the business of Xcel
Energy no longer allow for the application of SFAS No. 71 under GAAP, Xcel Energy would be required to recognize the write-off of regulatory
assets and liabilities in its Statements of Operations. The components of unamortized regulatory assets and liabilities of continuing operations
shown on the balance sheet at Dec. 31 were:
Remaining
(Thousands of dollars) See Note(s) Amortization Period 2005 2004
Regulatory Assets
Net nuclear asset retirement obligations 1, 15 End of licensed life $ 282,195 $ 221,864
Contract valuation adjustments
(e)
12 Term of related contract 111,639 102,741
AFDC recorded in plant
(a)
Plant lives 170,785 169,352
Losses on reacquired debt 1 Term of related debt 84,290 89,694
Conservation programs
(a)
Various 111,429 88,253
Nonnuclear asset retirement obligations 14 Plant lives 32,371 –
Nuclear decommissioning costs
(b)
Up to two years 8,317 20,494
Employees’ postretirement benefits other than pension 10 Seven years 27,234 31,125
Renewable resource costs One to two years 50,453 38,985
Environmental costs 14, 15 Varies, generally
four to six years 33,957 28,176
State commission accounting adjustments
(a)
Plant lives 14,460 15,945
Plant asset recovery (Pawnee II and Metro Ash) 18 months 7,355 12,258
Unrecovered natural gas costs
(c)
1 One to two years 12,998 14,553
Unrecovered electric production and transmission costs
(d)
1 To be determined 6,634 –
Other Various 9,286 17,196
Total regulatory assets $ 963,403 $ 850,636
Regulatory Liabilities
Plant removal costs 1, 15 $ 895,653 $ 891,018
Pension costs – regulatory differences 10 397,261 377,893
Contract valuation adjustments
(e)
12 99,734 56,874
Unrealized gains from decommissioning investments 15 143,396 129,028
Investment tax credit deferrals 84,437 92,227
Deferred income tax adjustments 1 75,171 69,780
Interest on income tax refunds 6,031 9,667
Fuel costs, refunds and other 9,137 4,058
Total regulatory liabilities $1,710,820 $1,630,545
(a) Earns a return on investment in the ratemaking process. These amounts are amortized consistent with recovery in rates.
(b) These costs do not relate to NSP-Minnesota’s nuclear plants. They relate to DOE assessments, as discussed previously in Note 15. In 2004, these
costs also included unamortized costs for PSCo’s Fort St. Vrain nuclear plant decommissioning.
(c) Excludes current portion expected to be returned to customers within 12 months of $16.3 million and $12.4 million for 2005 and 2004, respectively.
(d) In 2004, excluded the current portion expected to be recovered within the next 12 months of $16.1 million.
(e) Includes the fair value of certain long-term contracts used to meet native energy requirements.
80 XCEL ENERGY 2005 ANNUAL REPORT
NOTES TO CONSOLIDATED FINANCIAL STATEMENTS