Xcel Energy 2005 Annual Report Download - page 20
Download and view the complete annual report
Please find page 20 of the 2005 Xcel Energy annual report below. You can navigate through the pages in the report by either clicking on the pages listed below, or by using the keyword search tool below to find specific information within the annual report.-
 1
1 -
2
-
3
-
4
-
5
-
6
-
7
-
8
-
9
-
 10
10 -
 11
11 -
 12
12 -
 13
13 -
 14
14 -
 15
15 -
 16
16 -
 17
17 -
 18
18 -
 19
19 -
 20
20 -
 21
21 -
 22
22 -
 23
23 -
 24
24 -
 25
25 -
 26
26 -
 27
27 -
 28
28 -
 29
29 -
 30
30 -
31
-
32
-
33
-
34
-
35
-
36
-
37
-
38
-
39
-
40
-
41
-
42
-
43
-
44
-
45
-
46
-
47
-
48
-
49
-
50
-
51
-
52
-
53
-
54
-
55
-
56
-
57
-
58
-
59
-
60
-
61
-
62
-
63
-
64
-
65
-
66
-
67
-
68
-
69
-
70
-
71
-
72
-
73
-
74
-
75
-
76
-
77
-
78
-
79
-
80
-
81
-
82
-
83
-
84
-
85
-
86
-
87
-
88
 |
 |

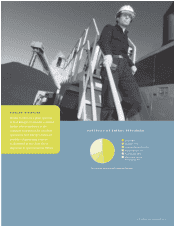
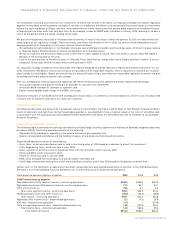
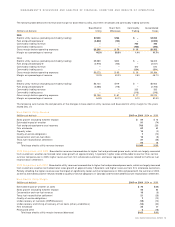
Contribution to earnings per share 2005 2004 2003
GAAP earnings (loss) per share contribution by segment
Regulated electric utility segment – continuing operations $1.04 $1.10 $1.10
Regulated natural gas utility segment – continuing operations 0.17 0.20 0.22
Other utility results
(a)
0.06 0.02 0.01
Total utility segment earnings per share – continuing operations 1.27 1.32 1.33
Holding company costs and other results
(a)
(0.07) (0.06) (0.07)
Total earnings per share – continuing operations 1.20 1.26 1.26
Regulated utility earnings (loss) – discontinued operations –(0.02) 0.06
NRG loss – discontinued operations –– (0.60)
Other nonregulated earnings (loss) – discontinued operations
(b)
0.03 (0.37) 0.78
Total earnings (loss) per share – discontinued operations 0.03 (0.39) 0.24
Total GAAP earnings per share – diluted $1.23 $0.87 $1.50
(a) Not a reportable segment. Included in All Other segment results in Note 17 to the Consolidated Financial Statements.
(b) Includes tax benefit related to NRG. See Note 2 to the Consolidated Financial Statements.
Earnings from continuing operations for 2005 were lower than in 2004. The 2005 results had higher operating margins, which were offset by
higher operating and maintenance expenses, including scheduled nuclear plant outages in 2005, higher employee benefit costs, higher
uncollectible receivable expense and higher depreciation expense. In addition, tax expense recorded in 2005 was higher than 2004, primarily
attributable to tax benefits recorded in 2004 related to the successful resolution of various income tax audit issues.
While earnings from continuing operations for 2004 were flat compared with 2003, 2004 results were favorably impacted by electric sales
growth, short-term wholesale markets and lower depreciation, offset by the negative impact of unfavorable weather, legal settlement costs
and the impact of certain regulatory accruals, compared with the same period in 2003.
Income from discontinued operations in 2005 includes the positive impact of a $17 million tax benefit recorded to reflect the final resolution
of Xcel Energy’s divested interest in NRG. This was partially offset by Seren’s operating losses during 2005.
The loss from discontinued operations in 2004 is largely due to an after-tax impairment charge of $143 million, or 34 cents per share, related
to Seren. In addition, the loss from discontinued operations in 2004 is attributable in part to an after-tax loss of $13 million, or 3 cents per
share, associated with the disposition of Cheyenne.
The earnings in 2003 from discontinued operations are primarily due to an adjustment to previously estimated tax benefits related to Xcel
Energy’s write-off of its investment in NRG. Results from discontinued operations are discussed in the Discontinued Operations section later.
Weather
Xcel Energy’s earnings can be significantly affected by weather. Unseasonably hot summers or cold winters increase electric and
natural gas sales, but also can increase expenses. Unseasonably mild weather reduces electric and natural gas sales, but may not reduce
expenses. The impact of weather on earnings is based on the number of customers, temperature variances and the amount of natural gas or
electricity the average customer historically has used per degree of temperature.
The following summarizes the estimated impact on the earnings of the utility subsidiaries of Xcel Energy due to temperature variations from
historical averages:
– Weather in 2005 increased earnings by an estimated 3 cents per share;
– Weather in 2004 decreased earnings by an estimated 8 cents per share; and
– Weather in 2003 was close to normal and had minimal impact on earnings per share.
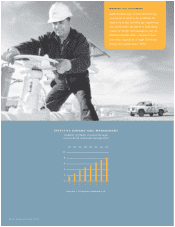
STATEMENT OF OPERATIONS ANALYSIS –CONTINUING OPERATIONS
The following discussion summarizes the items that affected the individual revenue and expense items reported in the Consolidated
Statements of Operations.
ELECTRIC UTILITY,SHORT-TERM WHOLESALE AND COMMODITY TRADING MARGINS
Electric fuel and purchased power expenses tend to vary with changing retail and wholesale sales requirements and unit cost changes in fuel
and purchased power. Due to fuel and purchased energy cost-recovery mechanisms for retail customers in several states, most fluctuations
in these costs do not materially affect electric utility margin.
Xcel Energy has two distinct forms of wholesale sales: short-term wholesale and commodity trading. Short-term wholesale refers to
energy-related purchase and sales activity, and the use of certain financial instruments associated with the fuel required for, and energy
produced from, Xcel Energy’s generation assets or the energy and capacity purchased to serve native load. Commodity trading is not
associated with Xcel Energy’s generation assets or the energy and capacity purchased to serve native load. Short-term wholesale and
commodity trading activities are considered part of the electric utility segment.
Short-term wholesale and commodity trading margins reflect the estimated impact of regulatory sharing, if applicable. Commodity trading
revenues are reported net of related costs (i.e., on a margin basis) in the Consolidated Statements of Operations. Commodity trading costs
include purchased power, transmission, broker fees and other related costs.
18 XCEL ENERGY 2005 ANNUAL REPORT
MANAGEMENT’S DISCUSSION AND ANALYSIS OF FINANCIAL CONDITION AND RESULTS OF OPERATIONS