Xcel Energy 2005 Annual Report Download - page 21
Download and view the complete annual report
Please find page 21 of the 2005 Xcel Energy annual report below. You can navigate through the pages in the report by either clicking on the pages listed below, or by using the keyword search tool below to find specific information within the annual report.-
 1
1 -
2
-
3
-
4
-
5
-
6
-
7
-
8
-
9
-
10
-
 11
11 -
 12
12 -
 13
13 -
 14
14 -
 15
15 -
 16
16 -
 17
17 -
 18
18 -
 19
19 -
 20
20 -
 21
21 -
 22
22 -
 23
23 -
 24
24 -
 25
25 -
 26
26 -
 27
27 -
 28
28 -
 29
29 -
 30
30 -
 31
31 -
32
-
33
-
34
-
35
-
36
-
37
-
38
-
39
-
40
-
41
-
42
-
43
-
44
-
45
-
46
-
47
-
48
-
49
-
50
-
51
-
52
-
53
-
54
-
55
-
56
-
57
-
58
-
59
-
60
-
61
-
62
-
63
-
64
-
65
-
66
-
67
-
68
-
69
-
70
-
71
-
72
-
73
-
74
-
75
-
76
-
77
-
78
-
79
-
80
-
81
-
82
-
83
-
84
-
85
-
86
-
87
-
88
 |
 |

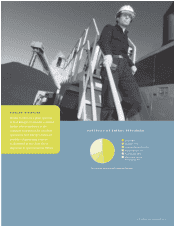
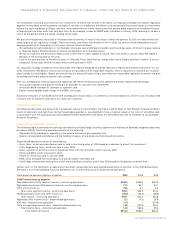
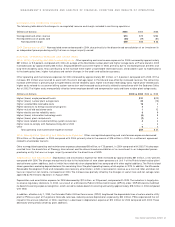
The following table details the revenue and margin for base electric utility, short-term wholesale and commodity trading activities:
Base Electric Short-Term Commodity Consolidated
(Millions of dollars) Utility Wholesale Trading Totals
2005
Electric utility revenue (excluding commodity trading) $7,038 $196 $ – $7,234
Fuel and purchased power (3,802) (120) – (3,922)
Commodity trading revenue – – 730 730
Commodity trading costs – – (720) (720)
Gross margin before operating expenses $3,236 $ 76 $ 10 $3,322
Margin as a percentage of revenue 46.0% 38.8% 1.4% 41.7%
2004
Electric utility revenue (excluding commodity trading) $5,989 $220 $ – $6,209
Fuel and purchased power (2,916) (125) – (3,041)
Commodity trading revenue – – 610 610
Commodity trading costs – – (594) (594)
Gross margin before operating expenses $3,073 $ 95 $ 16 $3,184
Margin as a percentage of revenue 51.3% 43.2% 2.6% 46.7%
2003
Electric utility revenue (excluding commodity trading) $5,724 $179 $ – $5,903
Fuel and purchased power (2,588) (118) – (2,706)
Commodity trading revenue – – 333 333
Commodity trading costs – – (316) (316)
Gross margin before operating expenses $3,136 $ 61 $ 17 $3,214
Margin as a percentage of revenue 54.8% 34.1% 5.1% 51.5%
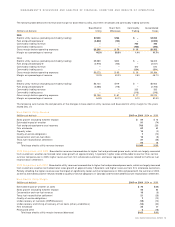
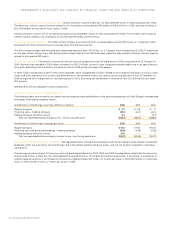
The following summarizes the components of the changes in base electric utility revenue and base electric utility margin for the years
ended Dec. 31:
Base Electric Utility Revenue
(Millions of dollars) 2005 vs. 2004 2004 vs. 2003
Sales growth (excluding weather impact) $57 $73
Estimated impact of weather 91 (74)
Fuel and purchased power cost recovery 706 230
Firm wholesale 67 62
Capacity sales 15 (2)
Quality-of-service obligations 7(12)
Conservation and non-fuel riders 16 (5)
Texas fuel reconciliation settlement 21 (25)
Other 69 18
Total base electric utility revenue increase $1,049 $265
2005 Comparison with 2004
Base electric revenues increased due to higher fuel and purchased power costs, which are largely recovered
from customers; weather-normalized retail sales growth of approximately 1.4 percent; higher sales attributable to warmer than normal
summer temperatures in 2005; higher revenues from firm wholesale customers; and lower regulatory accruals related to the Texas fuel
reconciliation settlement.
2004 Comparison with 2003
Base electric utility revenues increased due to higher fuel and purchased power costs, which are largely recovered
from customers; weather-normalized retail sales growth of approximately 1.8 percent; and higher revenues from firm wholesale customers.
Partially offsetting the higher revenues was the impact of significantly cooler summer temperatures in 2004, compared with the summer of 2003,
as well as estimated customer refunds related to quality-of-service obligations in Colorado and the estimated Texas fuel reconciliation settlement.
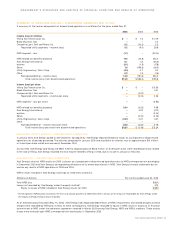
Base Electric Utility Margin
(Millions of dollars) 2005 vs. 2004 2004 vs. 2003
Estimated impact of weather on sales $75 $(56)
Sales growth (excluding weather impact) 42 55
Conservation and non-fuel revenue 16 (6)
Texas fuel reconciliation settlement 21 (25)
Quality-of-service obligations 7(12)
Under-recovery of fuel costs (NSP-Wisconsin) (15) (10)
Under-recovery and timing of recovery of fuel costs (other jurisdictions) (14) (20)
Firm wholesale 23 27
Pricing and other 8(16)
Total base electric utility margin increase (decrease) $163 $(63)
XCEL ENERGY 2005 ANNUAL REPORT 19
MANAGEMENT’S DISCUSSION AND ANALYSIS OF FINANCIAL CONDITION AND RESULTS OF OPERATIONS