Xcel Energy 2005 Annual Report Download - page 68
Download and view the complete annual report
Please find page 68 of the 2005 Xcel Energy annual report below. You can navigate through the pages in the report by either clicking on the pages listed below, or by using the keyword search tool below to find specific information within the annual report.-
 1
1 -
2
-
3
-
4
-
5
-
6
-
7
-
8
-
9
-
10
-
11
-
12
-
13
-
14
-
15
-
16
-
17
-
18
-
19
-
20
-
21
-
22
-
23
-
24
-
25
-
26
-
27
-
28
-
29
-
30
-
31
-
32
-
33
-
34
-
35
-
36
-
37
-
38
-
39
-
40
-
41
-
42
-
43
-
44
-
45
-
46
-
47
-
48
-
49
-
50
-
51
-
52
-
53
-
54
-
55
-
56
-
57
-
 58
58 -
 59
59 -
 60
60 -
 61
61 -
 62
62 -
 63
63 -
 64
64 -
 65
65 -
 66
66 -
 67
67 -
 68
68 -
 69
69 -
 70
70 -
 71
71 -
 72
72 -
 73
73 -
 74
74 -
 75
75 -
 76
76 -
 77
77 -
 78
78 -
79
-
80
-
81
-
82
-
83
-
84
-
85
-
86
-
87
-
88
 |
 |

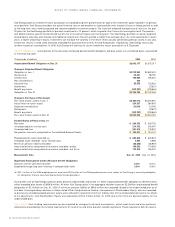
The following discussion briefly describes the use of derivative commodity and financial instruments at Xcel Energy and its subsidiaries, and
discloses the respective fair values at Dec. 31, 2005 and 2004.
Commodity Trading Instruments
At Dec. 31, 2005 and 2004, the fair value of commodity trading contracts was $3.9 million and $0.0 million,
respectively.
Hedging Contracts
The fair value of qualifying cash flow hedges at Dec. 31, 2005 and 2004 was $4.1 million and $(24.6) million, respectively.
Financial Instruments
Xcel Energy and its subsidiaries had interest rate swaps outstanding with a fair value that was a liability of
approximately $44.7 million at Dec. 31, 2005. On Dec. 31, 2004, subsidiaries of Xcel Energy had interest rate swaps outstanding with a fair
value that was a liability of approximately $30 million.
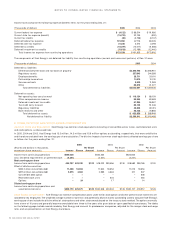
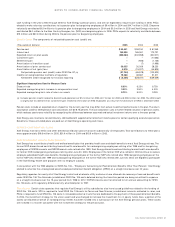
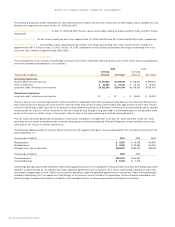
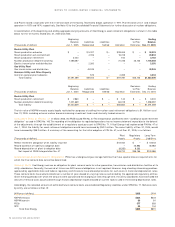
13. FINANCIAL INSTRUMENTS
The estimated Dec. 31 fair values of Xcel Energy’s financial instruments, separately identifying amounts that are within continuing operations
and within discontinued operations, are as follows:
2005 2004
Carrying Carrying
(Thousands of dollars) Amount Fair Value Amount Fair Value
Continuing Operations
Nuclear decommissioning fund $1,047,592 $1,047,592 $ 918,442 $ 918,442
Other investments $ 24,286 $ 24,050 $ 43,141 $ 43,031
Long-term debt, including current portion $6,733,284 $7,245,346 $6,716,675 $7,391,616
Discontinued Operations
Long-term debt, including current portion $ – $ – $ 24,800 $ 26,333
The fair value of cash and cash equivalents, notes and accounts receivable and notes and accounts payable are not materially different from
their carrying amounts because of the short-term nature of these instruments or because the stated rates approximate market rates. The fair
values of Xcel Energy’s debt securities in an external nuclear decommissioning fund and other investments are estimated based on quoted
market prices for those or similar investments. The fair values of Xcel Energy’s long-term debt is estimated based on the quoted market
prices for the same or similar issues, or the current rates for debt of the same remaining maturities and credit quality.
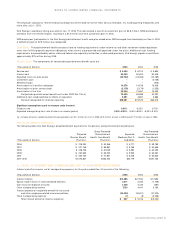
The fair value estimates presented are based on information available to management as of Dec. 31, 2005 and 2004. These fair value
estimates have not been comprehensively revalued for purposes of these Consolidated Financial Statements since that date, and current
estimates of fair values may differ significantly.
The following tables provide the external decommissioning fund’s approximate gains, losses and proceeds from the sale of securities for the
years ended Dec. 31:
(Thousands of dollars) 2005 2004 2003
Realized gains $ 8,967 $ 16,578 $ 4,999
Realized losses $ 8,990 $ 20,180 $ 6,025
Proceeds from sale of securities $489,697 $223,135 $57,768
(Thousands of dollars) 2005 2004
Unrealized gains $253,991 $240,960
Unrealized losses $ 10,558 $ 2,703
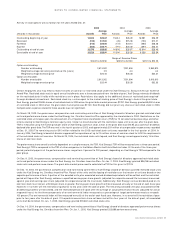
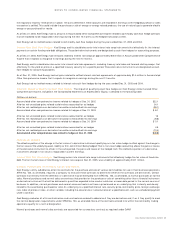
Xcel Energy provides guarantees and bond indemnities supporting certain of its subsidiaries. The guarantees issued by Xcel Energy guarantee
payment or performance by its subsidiaries under specified agreements or transactions. As a result, Xcel Energy’s exposure under the
guarantees is based upon the net liability of the relevant subsidiary under the specified agreements or transactions. Most of the guarantees
issued by Xcel Energy limit the exposure of Xcel Energy to a maximum amount stated in the guarantee. Unless otherwise indicated on the
following page, the guarantees require no liability to be recorded, contain no recourse provisions and require no collateral.
66 XCEL ENERGY 2005 ANNUAL REPORT
NOTES TO CONSOLIDATED FINANCIAL STATEMENTS