Xcel Energy 2005 Annual Report Download - page 43
Download and view the complete annual report
Please find page 43 of the 2005 Xcel Energy annual report below. You can navigate through the pages in the report by either clicking on the pages listed below, or by using the keyword search tool below to find specific information within the annual report.-
 1
1 -
2
-
3
-
4
-
5
-
6
-
7
-
8
-
9
-
10
-
11
-
12
-
13
-
14
-
15
-
16
-
17
-
18
-
19
-
20
-
21
-
22
-
23
-
24
-
25
-
26
-
27
-
28
-
29
-
30
-
31
-
32
-
 33
33 -
 34
34 -
 35
35 -
 36
36 -
 37
37 -
 38
38 -
 39
39 -
 40
40 -
 41
41 -
 42
42 -
 43
43 -
 44
44 -
 45
45 -
 46
46 -
 47
47 -
 48
48 -
 49
49 -
 50
50 -
 51
51 -
 52
52 -
 53
53 -
54
-
55
-
56
-
57
-
58
-
59
-
60
-
61
-
62
-
63
-
64
-
65
-
66
-
67
-
68
-
69
-
70
-
71
-
72
-
73
-
74
-
75
-
76
-
77
-
78
-
79
-
80
-
81
-
82
-
83
-
84
-
85
-
86
-
87
-
88
 |
 |

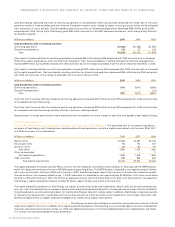
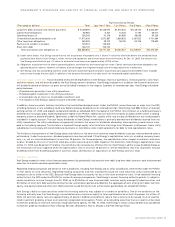
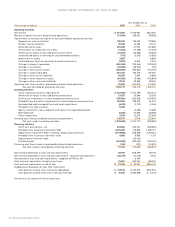
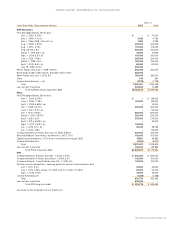
Year ended Dec. 31
(Thousands of dollars, except per share data) 2005 2004 2003
Operating revenues
Electric utility $7,243,637 $6,225,245 $5,919,938
Natural gas utility 2,307,385 1,915,514 1,677,768
Nonregulated and other 74,455 74,802 133,561
Total operating revenues 9,625,477 8,215,561 7,731,267
Operating expenses
Electric fuel and purchased power – utility 3,922,163 3,040,759 2,705,839
Cost of natural gas sold and transported – utility 1,823,123 1,445,773 1,190,996
Cost of sales – nonregulated and other 24,676 28,757 80,683
Other operating and maintenance expenses – utility 1,679,172 1,591,718 1,570,492
Other operating and maintenance expenses – nonregulated 28,493 44,109 53,485
Depreciation and amortization 767,321 705,955 727,307
Taxes (other than income taxes) 287,810 282,775 278,034
Total operating expenses 8,532,758 7,139,846 6,606,836
Operating income 1,092,719 1,075,715 1,124,431
Interest and other income (expense), net (see Note 11) 857 9,316 (5,234)
Allowance for funds used during construction – equity 21,627 33,648 25,338
Interest charges and financing costs
Interest charges – (includes other financing costs of $25,829, $27,296
and $31,992, respectively) 463,370 458,294 448,690
Allowance for funds used during construction – debt (20,744) (23,814) (20,402)
Distributions on redeemable preferred securities of subsidiary trusts –– 22,731
Total interest charges and financing costs 442,626 434,480 451,019
Income from continuing operations before income taxes 672,577 684,199 693,516
Income taxes 173,539 161,935 170,692
Income from continuing operations 499,038 522,264 522,824
Income (loss) from discontinued operations – net of tax (see Note 2) 13,934 (166,303) 99,568
Net income 512,972 355,961 622,392
Dividend requirements on preferred stock 4,241 4,241 4,241
Earnings available to common shareholders $ 508,731 $ 351,720 $ 618,151
Weighted average common shares outstanding (in thousands)
Basic 402,330 399,456 398,765
Diluted 425,671 423,334 418,912
Earnings (loss) per share – basic
Income from continuing operations $ 1.23 $ 1.30 $ 1.30
Income (loss) from discontinued operations (see Note 2) 0.03 (0.42) 0.25
Earnings per share $ 1.26 $ 0.88 $ 1.55
Earnings (loss) per share – diluted
Income from continuing operations $ 1.20 $ 1.26 $ 1.26
Income (loss) from discontinued operations (see Note 2) 0.03 (0.39) 0.24
Earnings per share $ 1.23 $ 0.87 $ 1.50
See Notes to Consolidated Financial Statements.
XCEL ENERGY 2005 ANNUAL REPORT 41
CONSOLIDATED STATEM ENTS OF OPERATIONS