Xcel Energy 2005 Annual Report Download - page 34
Download and view the complete annual report
Please find page 34 of the 2005 Xcel Energy annual report below. You can navigate through the pages in the report by either clicking on the pages listed below, or by using the keyword search tool below to find specific information within the annual report.-
 1
1 -
2
-
3
-
4
-
5
-
6
-
7
-
8
-
9
-
10
-
11
-
12
-
13
-
14
-
15
-
16
-
17
-
18
-
19
-
20
-
21
-
22
-
23
-
 24
24 -
 25
25 -
 26
26 -
 27
27 -
 28
28 -
 29
29 -
 30
30 -
 31
31 -
 32
32 -
 33
33 -
 34
34 -
 35
35 -
 36
36 -
 37
37 -
 38
38 -
 39
39 -
 40
40 -
 41
41 -
 42
42 -
 43
43 -
 44
44 -
45
-
46
-
47
-
48
-
49
-
50
-
51
-
52
-
53
-
54
-
55
-
56
-
57
-
58
-
59
-
60
-
61
-
62
-
63
-
64
-
65
-
66
-
67
-
68
-
69
-
70
-
71
-
72
-
73
-
74
-
75
-
76
-
77
-
78
-
79
-
80
-
81
-
82
-
83
-
84
-
85
-
86
-
87
-
88
 |
 |

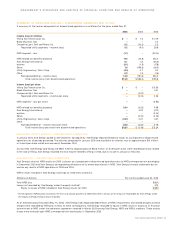
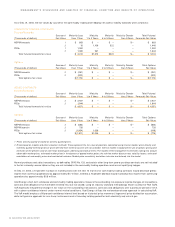
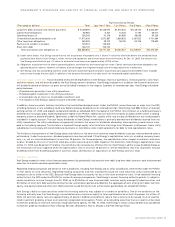
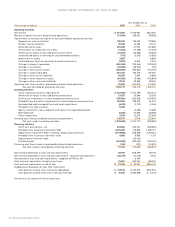
As of Dec. 31, 2005, the fair values by source for the commodity trading and hedging net asset or liability balances were as follows:
COMMODITY TRADING CONTRACTS
Futures/Forwards Source of Maturity Less Maturity Maturity Maturity Greater Total Futures/
(Thousands of dollars) Fair Value than 1 Year 1 to 3 Years 4 to 5 Years than 5 Years Forwards Fair Value
NSP-Minnesota
1
$ 663 $ – $ – $ – $ 663
2
15 1,109 322 – 1,446
PSCo
1
1,352 – – – 1,352
2
1,382 261 – – 1,643
Total futures/forwards fair value $ 3,412 $1,370 $322 $ – $ 5,104
Options Source of Maturity Less Maturity Maturity Maturity Greater Total Options
(Thousands of dollars) Fair Value than 1 Year 1 to 3 Years 4 to 5 Years than 5 Years Fair Value
NSP-Minnesota
2
$ (251) $ – $ – $ – $ (251)
PSCo
2
(922) – – – (922)
Total options fair value $(1,173) $ – $ – $ – $(1,173)
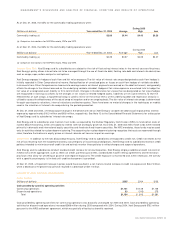
HEDGE CONTRACTS
Futures/Forwards Source of Maturity Less Maturity Maturity Maturity Greater Total Futures/
(Thousands of dollars) Fair Value than 1 Year 1 to 3 Years 4 to 5 Years than 5 Years Forwards Fair Value
NSP-Minnesota
2
$ 2,927 $ – $ – $ – $ 2,927
PSCo
2
1,944 – – – 1,944
Total futures/forwards fair value $ 4,871 $ – $ – $ – $ 4,871
Options Source of Maturity Less Maturity Maturity Maturity Greater Total Options
(Thousands of dollars) Fair Value than 1 Year 1 to 3 Years 4 to 5 Years than 5 Years Fair Value
NSP-Minnesota
2
$ (583) $ – $ – $ – $ (583)
NSP-Wisconsin
2
726 – – – 726
PSCo
2
(1,954) 1,036 – – (918)
Total options fair value $(1,811) $1,036 $ – $ – $ (775)
1 Prices actively quoted or based on actively quoted prices.
2 Prices based on models and other valuation methods. These represent the fair value of positions calculated using internal models when directly and
indirectly quoted external prices or prices derived from external sources are not available. Internal models incorporate the use of options pricing and
estimates of the present value of cash flows based upon underlying contractual terms. The models reflect management’s estimates, taking into account
observable market prices, estimated market prices in the absence of quoted market prices, the risk-free market discount rate, volatility factors, estimated
correlations of commodity prices and contractual volumes. Market price uncertainty and other risks also are factored into the model.
Normal purchases and sales transactions, as defined by SFAS No. 133, and certain other long-term power purchase contracts are not included
in the fair values by source tables as they are not included in the commodity trading operations and are not qualifying hedges.
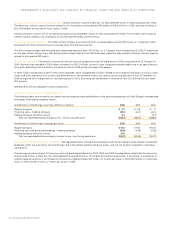
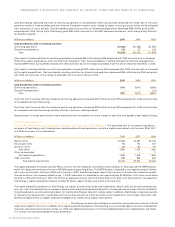
At Dec. 31, 2005, a 10-percent increase in market prices over the next 12 months for commodity trading contracts would decrease pretax
income from continuing operations by approximately $0.7 million, whereas a 10-percent decrease would increase pretax income from continuing
operations by approximately $0.8 million.
Xcel Energy’s short-term wholesale and commodity trading operations measure the outstanding risk exposure to price changes on transactions,
contracts and obligations that have been entered into, but not closed, using an industry standard methodology known as Value-at-Risk (VaR).
VaR expresses the potential change in fair value on the outstanding transactions, contracts and obligations over a particular period of time,
with a given confidence interval under normal market conditions. Xcel Energy utilizes the variance/covariance approach in calculating VaR.
The VaR model employs a 95-percent confidence interval level based on historical price movement, lognormal price distribution assumption,
delta half-gamma approach for non-linear instruments and a three-day holding period for both electricity and natural gas.
32 XCEL ENERGY 2005 ANNUAL REPORT
MANAGEMENT’S DISCUSSION AND ANALYSIS OF FINANCIAL CONDITION AND RESULTS OF OPERATIONS