Xcel Energy 2005 Annual Report Download - page 65
Download and view the complete annual report
Please find page 65 of the 2005 Xcel Energy annual report below. You can navigate through the pages in the report by either clicking on the pages listed below, or by using the keyword search tool below to find specific information within the annual report.
The employer subsidy for retiree medical coverage was eliminated for former New Century Energies, Inc. nonbargaining employees who
retire after July 1, 2003.
Xcel Energy’s subsidiary Viking was sold on Jan. 17, 2003. The sale created a one-time curtailment gain of $0.8 million. NRG participants
withdrew from the retiree life plan, resulting in a $1.3 million one-time curtailment gain in 2003.
NRG employees’ participation in the Xcel Energy postretirement health care plan ended when NRG emerged from bankruptcy on Dec. 5, 2003.
A settlement gain of $0.9 million was recognized.
Cash Flows
The postretirement health care plans have no funding requirements under income tax and other retirement-related regulations
other than fulfilling benefit payment obligations when claims are presented and approved under the plans. Additional cash funding
requirements are prescribed by certain state and federal rate regulatory authorities, as discussed previously. Xcel Energy expects to contribute
approximately $75 million during 2006.
Benefit Costs
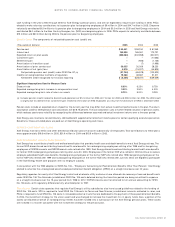
The components of net periodic postretirement benefit costs are:
(Thousands of dollars) 2005 2004 2003
Service cost $ 6,684 $ 6,100 $ 5,893
Interest cost 55,060 52,604 52,426
Expected return on plan assets (25,700) (23,066) (22,185)
Curtailment gain –– (2,128)
Settlement gain –– (916)
Amortization of transition obligation 14,578 14,578 15,426
Amortization of prior service credit (2,178) (2,179) (1,533)
Amortization of net loss 26,246 21,651 15,409
Net periodic postretirement benefit cost under SFAS No. 106
(a)
74,690 69,688 62,392
Additional cost recognized due to effects of regulation 3,891 3,891 3,883
Net cost recognized for financial reporting $78,581 $73,579 $66,275
Significant assumptions used to measure costs (income)
Discount rate 6.00% 6.25% 6.75%
Expected average long-term rate of return on assets (pretax) 5.50%–8.50% 5.50%–8.50% 8.00%–9.00%
(a) Includes amounts related to discontinued operations of $1.1 million of cost in 2005, $1.3 million of cost in 2004 and $(1.7) million of cost in 2003.
PROJECTED BENEFIT PAYMENTS
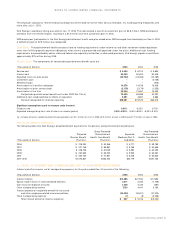
The following table lists Xcel Energy’s projected benefit payments for the pension and postretirement benefit plans:
Gross Projected Net Projected
Projected Postretirement Expected Postretirement
Pension Benefit Health Care Benefit Medicare Part D Health Care Benefit
(Thousands of dollars) Payments Payments Subsidies Payments
2006 $ 218,093 $ 63,966 $ 4,777 $ 59,189
2007 $ 221,166 $ 65,851 $ 5,196 $ 60,655
2008 $ 228,196 $ 67,635 $ 5,582 $ 62,053
2009 $ 234,663 $ 69,303 $ 5,936 $ 63,367
2010 $ 239,730 $ 70,851 $ 6,248 $ 64,603
2011–2015 $1,216,821 $366,454 $34,719 $331,735
11. DETAIL OF INTEREST AND OTHER INCOME, NET OF NONOPERATING EXPENSE
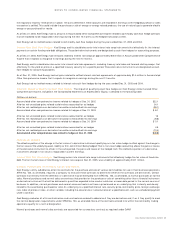
Interest and other income, net of nonoperating expense, for the years ended Dec. 31 consists of the following:
(Thousands of dollars) 2005 2004 2003
Interest income $14,886 $21,534 $17,653
Equity income (loss) in unconsolidated affiliates 2,511 3,225 (1,108)
Gain (loss) on disposal of assets 1,308 4,725 (581)
Other nonoperating income 7,153 4,441 3,160
Interest expense on corporate-owned life insurance
and other employee-related insurance policies (25,000) (24,601) (21,320)
Other nonoperating expense (1) (8) (3,038)
Total interest and other income (expense) $ 857 $ 9,316 $(5,234)
XCEL ENERGY 2005 ANNUAL REPORT 63
NOTES TO CONSOLIDATED FINANCIAL STATEMENTS


