Xcel Energy 2005 Annual Report Download - page 22
Download and view the complete annual report
Please find page 22 of the 2005 Xcel Energy annual report below. You can navigate through the pages in the report by either clicking on the pages listed below, or by using the keyword search tool below to find specific information within the annual report.-
 1
1 -
2
-
3
-
4
-
5
-
6
-
7
-
8
-
9
-
10
-
11
-
 12
12 -
 13
13 -
 14
14 -
 15
15 -
 16
16 -
 17
17 -
 18
18 -
 19
19 -
 20
20 -
 21
21 -
 22
22 -
 23
23 -
 24
24 -
 25
25 -
 26
26 -
 27
27 -
 28
28 -
 29
29 -
 30
30 -
 31
31 -
 32
32 -
33
-
34
-
35
-
36
-
37
-
38
-
39
-
40
-
41
-
42
-
43
-
44
-
45
-
46
-
47
-
48
-
49
-
50
-
51
-
52
-
53
-
54
-
55
-
56
-
57
-
58
-
59
-
60
-
61
-
62
-
63
-
64
-
65
-
66
-
67
-
68
-
69
-
70
-
71
-
72
-
73
-
74
-
75
-
76
-
77
-
78
-
79
-
80
-
81
-
82
-
83
-
84
-
85
-
86
-
87
-
88
 |
 |

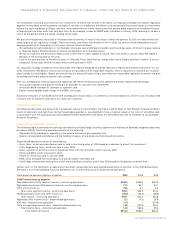
2005 Comparison to 2004
Base electric utility margin increased due to the impact of weather, weather-normalized sales growth, higher
firm wholesale margins, higher conservation and non-fuel rider revenues and lower accruals related to the fuel reconciliation proceedings in
Texas, partially offset by higher amortization expense and lower regulatory accruals associated with potential customer refunds related to
service-quality obligations in Colorado. These increases were partially offset by higher fuel and purchased energy costs not recovered through
direct pass-through recovery mechanisms.
2004 Comparison to 2003
Base electric utility margin decreased due to the impact of weather, higher fuel and purchased energy costs not
recovered through direct pass-through recovery mechanisms and regulatory accruals associated with potential customer refunds related to
service-quality obligations in Colorado and fuel-reconciliation proceedings in Texas. These decreases were partially offset by weather-normalized
sales growth.
Short-Term Wholesale and Commodity Trading Margin
2005 Comparison to 2004
Short-term wholesale and commodity trading margins decreased $25 million for 2005 compared with 2004. The
higher 2004 results reflect the impact of more favorable market conditions and higher levels of surplus generation available to sell. In addition,
a pre-existing contract contributed $17 million of margin in the first quarter of 2004 and expired at that time.
2004 Comparison to 2003
Short-term wholesale and commodity trading margins increased approximately $33 million in 2004 compared
with 2003. The increase reflects a number of market factors, including higher market prices and additional resources available for sale, and
the pre-existing contract described above.
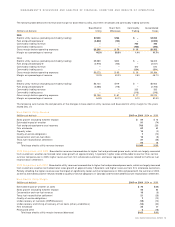
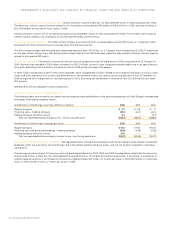
NATURAL GAS UTILITY MARGINS
The following table details the changes in natural gas utility revenue and margin. The cost of natural gas tends to vary with changing sales
requirements and the unit cost of wholesale natural gas purchases. However, due to purchased natural gas cost-recovery mechanisms for
sales to retail customers, fluctuations in the wholesale cost of natural gas have little effect on natural gas margin. See further discussion
under Factors Affecting Results of Continuing Operations.
(Millions of dollars) 2005 2004 2003
Natural gas utility revenue $2,307 $1,916 $1,678
Cost of natural gas purchased and transported (1,823) (1,446) (1,191)
Natural gas utility margin $ 484 $ 470 $ 487
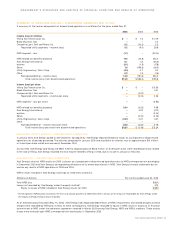
The following summarizes the components of the changes in natural gas revenue and margin for the years ended Dec. 31:
Natural Gas Revenue
(Millions of dollars) 2005 vs. 2004 2004 vs. 2003
Sales growth (excluding weather impact) $– $ (3)
Purchased natural gas adjustment clause recovery 397 257
Rate changes – Colorado, Minnesota and North Dakota 6(15)
Estimated impact of weather (5) (10)
Transportation and other (7) 9
Total natural gas revenue increase $391 $238
2005 Comparison to 2004
Natural gas revenue increased primarily due to higher natural gas costs in 2005, which are recovered from
customers. Retail natural gas weather-normalized sales were flat when compared to 2004, largely due to the rising cost of natural gas and its
impact on customer usage.
2004 Comparison to 2003
Natural gas revenue increased primarily due to higher natural gas costs in 2004, which are recovered from
customers. Retail natural gas weather-normalized sales declined in 2004, largely due to the rising cost of natural gas and its impact on
customer usage.
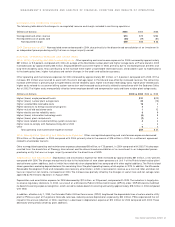
Natural Gas Margin
(Millions of dollars) 2005 vs. 2004 2004 vs. 2003
Sales growth (excluding weather impact) $1 $–
Estimated impact of weather on firm sales (2) (5)
Rate changes – Colorado, Minnesota and North Dakota 6(15)
Transportation 61
Other 32
Total natural gas margin increase (decrease) $14 $(17)
2005 Comparison to 2004
Natural gas margin increased due to rate changes in Minnesota and North Dakota, and higher transportation
margins, partially offset by the impact of warmer winter temperatures in 2005 compared with 2004.
2004 Comparison to 2003
Natural gas margin decreased due to a full year of a base rate decrease in Colorado, which was effective
July 1, 2003, and the impact of warmer winter temperatures in 2004 compared with 2003.
20 XCEL ENERGY 2005 ANNUAL REPORT
MANAGEMENT’S DISCUSSION AND ANALYSIS OF FINANCIAL CONDITION AND RESULTS OF OPERATIONS