Xcel Energy 2005 Annual Report Download - page 44
Download and view the complete annual report
Please find page 44 of the 2005 Xcel Energy annual report below. You can navigate through the pages in the report by either clicking on the pages listed below, or by using the keyword search tool below to find specific information within the annual report.-
 1
1 -
2
-
3
-
4
-
5
-
6
-
7
-
8
-
9
-
10
-
11
-
12
-
13
-
14
-
15
-
16
-
17
-
18
-
19
-
20
-
21
-
22
-
23
-
24
-
25
-
26
-
27
-
28
-
29
-
30
-
31
-
32
-
33
-
 34
34 -
 35
35 -
 36
36 -
 37
37 -
 38
38 -
 39
39 -
 40
40 -
 41
41 -
 42
42 -
 43
43 -
 44
44 -
 45
45 -
 46
46 -
 47
47 -
 48
48 -
 49
49 -
 50
50 -
 51
51 -
 52
52 -
 53
53 -
 54
54 -
55
-
56
-
57
-
58
-
59
-
60
-
61
-
62
-
63
-
64
-
65
-
66
-
67
-
68
-
69
-
70
-
71
-
72
-
73
-
74
-
75
-
76
-
77
-
78
-
79
-
80
-
81
-
82
-
83
-
84
-
85
-
86
-
87
-
88
 |
 |

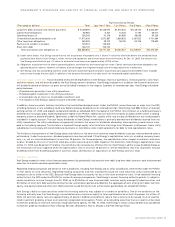
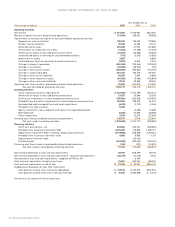
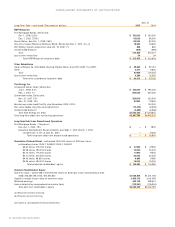
Year ended Dec. 31
(Thousands of dollars) 2005 2004 2003
Operating activities
Net income $ 512,972 $ 355,961 $622,392
Remove (income) loss from discontinued operations (13,934) 166,303 (99,568)
Adjustments to reconcile net income to cash provided by operating activities:
Depreciation and amortization 782,074 739,025 757,838
Nuclear fuel amortization 45,330 43,296 43,401
Deferred income taxes 205,058 57,273 100,869
Amortization of investment tax credits (11,620) (12,189) (12,439)
Allowance for equity funds used during construction (21,627) (33,648) (25,338)
Undistributed equity in earnings of unconsolidated affiliates (712) (3,342) (4,833)
Impairment of assets 2,887 – 8,856
Unrealized gain (loss) on derivative financial instruments (3,923) 6,206 2,404
Change in accounts receivable (250,305) (123,044) (129,408)
Change in inventories (94,605) (46,220) (911)
Change in other current assets (289,250) (190,827) (174,793)
Change in accounts payable 281,430 133,278 106,087
Change in other current liabilities 30,923 2,494 (4,855)
Change in other noncurrent assets (81,506) (6,485) (142,849)
Change in other noncurrent liabilities 37,242 39,669 59,306
Operating cash flows (used in) provided by discontinued operations 53,283 (314,575) 274,582
Net cash provided by operating activities 1,183,717 813,175 1,380,741
Investing activities
Utility capital/construction expenditures (1,304,468) (1,274,290) (944,421)
Allowance for equity funds used during construction 21,627 33,648 25,338
Purchase of investments in external decommissioning fund (576,001) (305,328) (144,367)
Proceeds from the sale of investments in external decommissioning fund 494,529 228,676 61,031
Nonregulated capital expenditures and asset acquisitions (6,976) (2,122) (2,055)
Proceeds from sale of assets 11,228 ––
Equity investments, loans, deposits and sales of nonregulated projects –(4,082) 10,588
Restricted cash (6,226) 42,628 (38,488)
Other investments 5,075 12,474 (22,380)
Investing cash flows provided by discontinued operations 135,577 37,119 125,904
Net cash used in investing activities (1,225,635) (1,231,277) (928,850)
Financing activities
Short-term borrowings – net 433,820 253,737 (428,580)
Proceeds from issuance of long-term debt 2,529,408 419,848 1,689,317
Repayment of long-term debt, including reacquisition premiums (2,517,698) (438,595) (1,307,012)
Proceeds from issuance of common stock 9,085 6,985 3,219
Repurchase of common stock –(32,023) –
Dividends paid (343,092) (320,444) (303,316)
Financing cash flows (used in) provided by discontinued operations (200) (200) (20,500)
Net cash (used in) provided by financing activities 111,323 (110,692) (366,872)
Net increase (decrease) in cash and cash equivalents 69,405 (528,794) 85,019
Net increase (decrease) in cash and cash equivalents – discontinued operations (20,570) (12,018) 6,510
Net increase in cash and cash equivalents – adoption of FIN No. 46 –3,439 –
Cash and cash equivalents at beginning of year 23,361 560,734 469,205
Cash and cash equivalents at end of year $ 72,196 $ 23,361 $560,734
Supplemental disclosure of cash flow information
Cash paid for interest (net of amounts capitalized) $417,016 $ 423,673 $402,506
Cash paid for income taxes (net of refunds received) $ 10,625 $(355,639) $ (6,379)
See Notes to Consolidated Financial Statements.
42 XCEL ENERGY 2005 ANNUAL REPORT
CONSOLIDATED STATEM ENTS OF CASH FLOWS