Xcel Energy 2005 Annual Report Download - page 36
Download and view the complete annual report
Please find page 36 of the 2005 Xcel Energy annual report below. You can navigate through the pages in the report by either clicking on the pages listed below, or by using the keyword search tool below to find specific information within the annual report.-
 1
1 -
2
-
3
-
4
-
5
-
6
-
7
-
8
-
9
-
10
-
11
-
12
-
13
-
14
-
15
-
16
-
17
-
18
-
19
-
20
-
21
-
22
-
23
-
24
-
25
-
 26
26 -
 27
27 -
 28
28 -
 29
29 -
 30
30 -
 31
31 -
 32
32 -
 33
33 -
 34
34 -
 35
35 -
 36
36 -
 37
37 -
 38
38 -
 39
39 -
 40
40 -
 41
41 -
 42
42 -
 43
43 -
 44
44 -
 45
45 -
 46
46 -
47
-
48
-
49
-
50
-
51
-
52
-
53
-
54
-
55
-
56
-
57
-
58
-
59
-
60
-
61
-
62
-
63
-
64
-
65
-
66
-
67
-
68
-
69
-
70
-
71
-
72
-
73
-
74
-
75
-
76
-
77
-
78
-
79
-
80
-
81
-
82
-
83
-
84
-
85
-
86
-
87
-
88
 |
 |

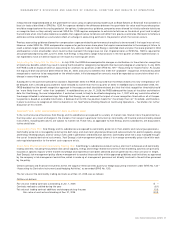
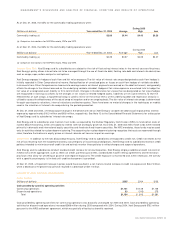
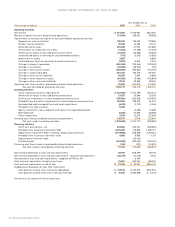
Cash provided by operating activities for continuing operations increased $22 million during 2004 compared with 2003, due to timing of
payments made for trade payables partially offset by increased inventory costs related to higher natural gas costs, which will be collected
from customers in future periods. Cash provided by operating activities for discontinued operations decreased $590 million during 2004
compared with 2003. During 2004, Xcel Energy paid $752 million pursuant to the NRG settlement agreement, which was partially offset by
tax benefits received.
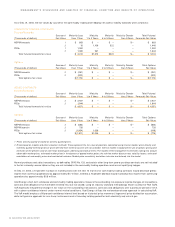
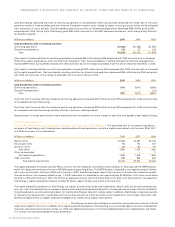
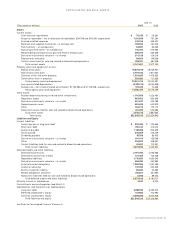
(Millions of dollars) 2005 2004 2003
Cash provided by (used in) investing activities
Continuing operations $(1,362) $(1,268) $(1,055)
Discontinued operations 136 37 126
Total $(1,226) $(1,231) $ (929)
Cash used in investing activities for continuing operations increased $94 million during 2005 compared with 2004, primarily due to increased
2005 utility capital expenditures and restricted cash released in 2004. Cash provided by investing activities for discontinued operations
increased $99 million during 2005 compared with 2004, primarily due to the receipt of proceeds from the sale of Cheyenne and Seren in 2005.
Cash used in investing activities for continuing operations increased $213 million during 2004 compared with 2003, primarily due to increased
utility capital expenditures. Cash provided by investing activities for discontinued operations decreased $89 million during 2004 compared
with 2003, primarily due to the receipt of proceeds from the sale of Viking in 2003.
(Millions of dollars) 2005 2004 2003
Cash provided by (used in) financing activities
Continuing operations $111 $(111) $(346)
Discontinued operations –– (21)
Total $111 $(111) $(367)
Cash flow from financing activities related to continuing operations increased $222 million during 2005 compared with 2004, primarily due
to increased short-term borrowings.
Cash flow from financing activities related to continuing operations increased $235 million during 2004 compared with 2003, primarily due
to increased short-term borrowings partially offset by a common stock repurchase.
See discussion of trends, commitments and uncertainties with the potential for future impact on cash flow and liquidity under Capital Sources.
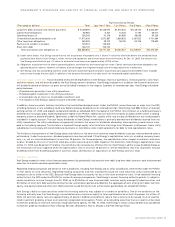
CAPITAL REQUIREMENTS
Utility Capital Expenditures, Nonregulated Investments and Long-Term Debt Obligations
The estimated cost of the capital expenditure
programs of Xcel Energy and its subsidiaries, excluding discontinued operations, and other capital requirements for the years 2006, 2007
and 2008 are shown in the table below.
(Millions of dollars) 2006 2007 2008
Electric utility $1,386 $1,381 $1,169
Natural gas utility 110 113 132
Common utility 84 81 81
Total utility 1,580 1,575 1,382
Other nonregulated ––2
Total capital expenditures 1,580 1,575 1,384
Debt maturities 835 339 632
Total capital requirements $2,415 $1,914 $2,016
The capital expenditure forecast includes PSCo’s share of the 750-megawatt Comanche 3 coal-fired plant in Colorado and the MERP project,
which will reduce the emissions of three of NSP-Minnesota’s generating plants. The MERP project is expected to cost approximately $1 billion,
with major construction starting in 2005 and finishing in 2009. Xcel Energy began recovering the costs of the emission-reduction project
through customer rate increases effective Jan. 1, 2006. Comanche 3 is expected to cost approximately $1.35 billion, with major construction
starting in 2006 and finishing in 2010. The CPUC has approved sharing one-third ownership of this plant with other parties. Consequently,
Xcel Energy’s capital expenditure forecast includes $1 billion, approximately two-thirds of the total cost.
The capital expenditure programs of Xcel Energy are subject to continuing review and modification. Actual utility construction expenditures
may vary from the estimates due to changes in electric and natural gas projected load growth, the desired reserve margin and the availability
of purchased power, as well as alternative plans for meeting Xcel Energy’s long-term energy needs. In addition, Xcel Energy’s ongoing evaluation
of restructuring requirements, compliance with future requirements to install emission-control equipment, and merger, acquisition and
divestiture opportunities to support corporate strategies may impact actual capital requirements.
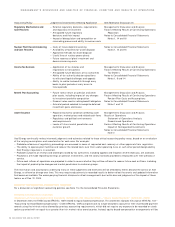
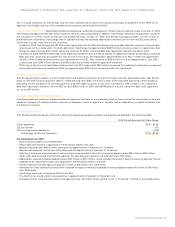
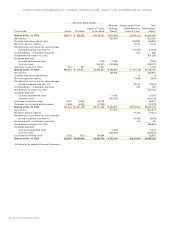
Contractual Obligations and Other Commitments
Xcel Energy has contractual obligations and other commercial commitments that will
need to be funded in the future, in addition to its capital expenditure programs. The following is a summarized table of contractual obligations
and other commercial commitments at Dec. 31, 2005. See additional discussion in the Consolidated Statements of Capitalization and Notes
3, 4, 13 and 14 to the Consolidated Financial Statements.
34 XCEL ENERGY 2005 ANNUAL REPORT
MANAGEMENT’S DISCUSSION AND ANALYSIS OF FINANCIAL CONDITION AND RESULTS OF OPERATIONS