Whirlpool 2007 Annual Report Download - page 9
Download and view the complete annual report
Please find page 9 of the 2007 Whirlpool annual report below. You can navigate through the pages in the report by either clicking on the pages listed below, or by using the keyword search tool below to find specific information within the annual report.-
 1
1 -
 2
2 -
 3
3 -
 4
4 -
 5
5 -
 6
6 -
 7
7 -
 8
8 -
 9
9 -
 10
10 -
 11
11 -
 12
12 -
 13
13 -
 14
14 -
 15
15 -
 16
16 -
 17
17 -
 18
18 -
 19
19 -
 20
20 -
21
-
22
-
23
-
24
-
25
-
26
-
27
-
28
-
29
-
30
-
31
-
32
-
33
-
34
-
35
-
36
-
37
-
38
-
39
-
40
-
41
-
42
-
43
-
44
-
45
-
46
-
47
-
48
-
49
-
50
-
51
-
52
-
53
-
54
-
55
-
56
-
57
-
58
-
59
-
60
-
61
-
62
-
63
-
64
-
65
-
66
-
67
-
68
-
69
-
70
-
71
-
72
-
73
-
74
-
75
-
76
-
77
-
78
-
79
-
80
-
81
-
82
-
83
-
84
-
85
-
86
-
87
-
88
-
89
-
90
-
91
-
92
-
93
-
94
-
95
-
96
-
97
-
98
-
99
-
100
-
101
-
102
-
103
-
104
-
105
-
106
-
107
-
108
-
109
-
110
-
111
-
112
-
113
-
114
-
115
-
116
-
117
-
118
-
119
-
120
-
121
-
122
-
123
-
124
-
125
-
126
-
127
-
128
 |
 |

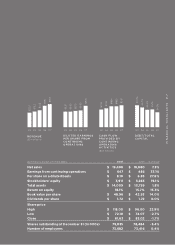
($ in millions, except per share data) 2007 2006 % Change
Net sales $ 19,408 $ 18,080 7.3%
Earnings from continuing operations $ 647 $ 486 33.1%
Per share on a diluted basis $ 8.10 $ 6.35 27.6%
Stockholders’ equity $ 3,911 $ 3,283 19.1%
Total assets $ 14,009 $ 13,759 1.8%
Return on equity 18.1% 15.7% 15.3%
Book value per share $ 48.96 $ 42.93 14.0%
Dividends per share $ 1.72 $ 1.72 0.0%
Share price
High $ 118.00 $ 96.00 22.9%
Low $ 72.10 $ 74.07 -2.7%
Close $ 81.63 $ 83.02 -1.7%
Shares outstanding at December 31 (in 000s) 75,835 78,484 -3.4%
Number of employees 73,682 73,416 0.4%
FINANCIAL HIGHLIGHTS P.7
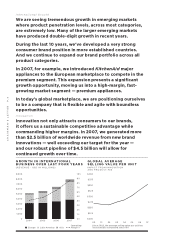
REVENUE
($ in billions)
03 04 05 06 07 03 04 05 06 07 03 04 05 06 07 03 04 05 06 07
DILUTED EARNINGS
PER SHARE FROM
CONTINUING
OPERATIONS
CASH FLOW
PROVIDED BY
CONTINUING
OPERATING
ACTIVITIES
($ in millions)
DEBT/TOTAL
CAPITAL
$12.2
$13.2
$14.3
$18.1
$19.4
$5.91
$5.90
$6.19
$6.35
$8.10
$744
$794
$884
$880
$927
50.9%
45.7%
40.4%
41.2%
34.5%