Whirlpool 2007 Annual Report Download - page 4
Download and view the complete annual report
Please find page 4 of the 2007 Whirlpool annual report below. You can navigate through the pages in the report by either clicking on the pages listed below, or by using the keyword search tool below to find specific information within the annual report.-
 1
1 -
 2
2 -
 3
3 -
 4
4 -
 5
5 -
 6
6 -
 7
7 -
 8
8 -
 9
9 -
 10
10 -
 11
11 -
 12
12 -
 13
13 -
 14
14 -
 15
15 -
16
-
17
-
18
-
19
-
20
-
21
-
22
-
23
-
24
-
25
-
26
-
27
-
28
-
29
-
30
-
31
-
32
-
33
-
34
-
35
-
36
-
37
-
38
-
39
-
40
-
41
-
42
-
43
-
44
-
45
-
46
-
47
-
48
-
49
-
50
-
51
-
52
-
53
-
54
-
55
-
56
-
57
-
58
-
59
-
60
-
61
-
62
-
63
-
64
-
65
-
66
-
67
-
68
-
69
-
70
-
71
-
72
-
73
-
74
-
75
-
76
-
77
-
78
-
79
-
80
-
81
-
82
-
83
-
84
-
85
-
86
-
87
-
88
-
89
-
90
-
91
-
92
-
93
-
94
-
95
-
96
-
97
-
98
-
99
-
100
-
101
-
102
-
103
-
104
-
105
-
106
-
107
-
108
-
109
-
110
-
111
-
112
-
113
-
114
-
115
-
116
-
117
-
118
-
119
-
120
-
121
-
122
-
123
-
124
-
125
-
126
-
127
-
128
 |
 |

CHAIRMAN’S LETTER P.2
FISCAL 2007 RESULTS
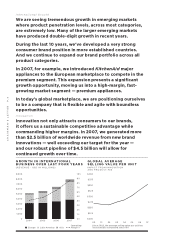
During 2007, we successfully managed a difficult operating
environment. We experienced the most challenging U.S.
industry conditions in more than two decades, and we
absorbed nearly $600 million in material and oil-related
cost increases. Yet, we saw record performance in our
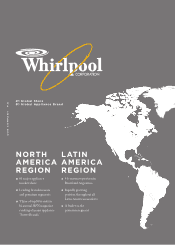
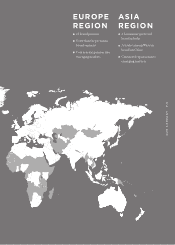
international businesses, led by Latin America and Europe.
And we continued to grow and deliver value-creating
results. Our 2007 highlights were as follows:
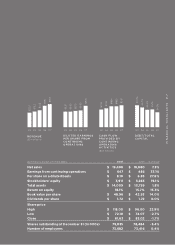
Net sales increased 7 percent to a record $19.4 billion.
Diluted earnings from continuing operations per share
increased 28 percent to $8.10.
Cash flow from operations reached $927 million, and
we were able to reduce total debt levels from $2.3 billion
to $2.1 billion.
The Maytag integration was completed, and we realized
more than $400 million in efficiencies.
$502 million was returned to shareholders in the form of
dividends and share repurchases.
STRATEGY EXECUTION
We remain committed to our brand value creation
strategy — focusing on innovation, cost productivity,
product quality and margin expansion. We continue to
improve our global operating platform to ensure we are
the best-cost and best-quality appliance manufacturer
worldwide. Our supply chain has been transformed to better
deliver products to trade customers and consumers. And
we are seeing the benefits of these actions today through
consolidated facilities, a stronger network, increased
efficiencies and timely deliveries.
BRAND PLATFORM
Best Consumer Position
TRADE PLATFORM
Best Trade Position
GLOBAL OPERATING PLATFORM
Best Cost, Quality and Delivery Position