Whirlpool 2007 Annual Report Download - page 112
Download and view the complete annual report
Please find page 112 of the 2007 Whirlpool annual report below. You can navigate through the pages in the report by either clicking on the pages listed below, or by using the keyword search tool below to find specific information within the annual report.-
 1
1 -
2
-
3
-
4
-
5
-
6
-
7
-
8
-
9
-
10
-
11
-
12
-
13
-
14
-
15
-
16
-
17
-
18
-
19
-
20
-
21
-
22
-
23
-
24
-
25
-
26
-
27
-
28
-
29
-
30
-
31
-
32
-
33
-
34
-
35
-
36
-
37
-
38
-
39
-
40
-
41
-
42
-
43
-
44
-
45
-
46
-
47
-
48
-
49
-
50
-
51
-
52
-
53
-
54
-
55
-
56
-
57
-
58
-
59
-
60
-
61
-
62
-
63
-
64
-
65
-
66
-
67
-
68
-
69
-
70
-
71
-
72
-
73
-
74
-
75
-
76
-
77
-
78
-
79
-
80
-
81
-
82
-
83
-
84
-
85
-
86
-
87
-
88
-
89
-
90
-
91
-
92
-
93
-
94
-
95
-
96
-
97
-
98
-
99
-
100
-
101
-
 102
102 -
 103
103 -
 104
104 -
 105
105 -
 106
106 -
 107
107 -
 108
108 -
 109
109 -
 110
110 -
 111
111 -
 112
112 -
 113
113 -
 114
114 -
 115
115 -
 116
116 -
 117
117 -
 118
118 -
 119
119 -
 120
120 -
 121
121 -
 122
122 -
123
-
124
-
125
-
126
-
127
-
128
 |
 |

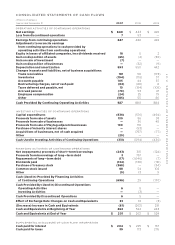
FINANCIAL SUMMARY P.110
• Asia net sales increased 21.9% in 2007 as compared to 2006 due to a higher average unit selling
price, increased volume and a favorable impact from changes in the value of foreign currency. The
increase in sales due to price is a result of an 11.8% higher average unit selling price as compared to
prior year. These increases are driven by the impact of successful new product introductions,
improved product mix and continued growth within India, the segment’s largest market. Excluding
the impact of foreign currency, Asia net sales increased 12.9% in 2007. Net sales increased 8.3% in 2006
as compared to 2005 due primarily to higher volume. Total units sold increased 6.1% compared to
2005 driven by strong demand, particularly in India, and favorable product mix. The average selling
price increased 2.1% in 2006, which contributed to the increase in net sales. Excluding the impact of
foreign currency, Asia net sales increased 10.1% in 2006.
Gross Margin The consolidated gross margin percentage in 2007 increased 20 basis points versus
2006. Strong international performance, acquisition efficiencies, productivity improvements,
regional tax incentives and asset sale gains had a positive impact on overall gross margin in 2007.
Partially offsetting these improvements were significantly higher material- and oil-related costs,
particularly in the United States. Included in gross margin for the year ended December 31, 2007
are asset sale gains of $65 million.
The table below summarizes gross margin percentages by region:
Gross Margin 2007 Change 2006 Change 2005
North America 12.5% (0.7) pts 13.2% (1.6) pts 14.8%
Europe 16.6 0.4 16.2 0.4 15.8
Latin America 20.8 1.6 19.2 2.2 17.0
Asia 15.2 (0.1) 15.3 3.9 11.4
Consolidated 14.9 0.2 14.7 (0.6) 15.3
Significant regional trends were as follows:
• North America gross margin decreased in 2007 compared to 2006 primarily due to higher
material- and oil-related costs and lower industry demand. This decrease was partially offset by favor-
able efficiencies as a result of synergies realized from the acquisition of Maytag, productivity improve-
ments, product innovation and an improved product mix as compared to 2006. Gross margin decreased
in 2006 compared to 2005, primarily due to higher material costs, lower industry demand, unfavorable
Maytag product mix, acquisition integration, purchase accounting costs and higher merchandising
costs. Margin declines were partially offset by productivity improvements and acquisition efficiencies.
• Europe gross margin increased in 2007 compared to 2006 as higher volumes, continued
productivity improvements and innovative product offerings more than offset higher material- and
oil-related costs. The sale of certain assets also contributed to higher gross margin. Gross margin
improved in 2006 compared to 2005 as productivity improvements more than offset lower comparable
model pricing and higher material- and oil-related costs. European operations continue to realize
savings from ongoing restructuring efforts in both 2007 and 2006.
• Latin America gross margin increased in 2007 compared to 2006, due primarily to continued
higher volumes, productivity improvements, cost based price increases and regional tax incentives
which combined to more than offset higher material- and oil-related costs and the unfavorable
impact of foreign currency. Gross margin increased in 2006 versus 2005, due primarily to significant-
ly improved volumes, productivity improvements, cost control initiatives and regional tax incentives
which combined to more than offset higher material- and oil-related costs and unfavorable currency
exchange rates.
• Asia gross margin decreased slightly in 2007 as compared to 2006, due to higher material- and
oil-related costs and inventory transition costs which were mitigated by productivity improvements,
improved product mix and higher volumes. Gross margin increased in 2006 as compared to 2005, due
to productivity improvements, improved product mix, and cost-based price adjustments which were
partially offset by higher material- and oil-related costs.