Whirlpool 2007 Annual Report Download - page 113
Download and view the complete annual report
Please find page 113 of the 2007 Whirlpool annual report below. You can navigate through the pages in the report by either clicking on the pages listed below, or by using the keyword search tool below to find specific information within the annual report.-
 1
1 -
2
-
3
-
4
-
5
-
6
-
7
-
8
-
9
-
10
-
11
-
12
-
13
-
14
-
15
-
16
-
17
-
18
-
19
-
20
-
21
-
22
-
23
-
24
-
25
-
26
-
27
-
28
-
29
-
30
-
31
-
32
-
33
-
34
-
35
-
36
-
37
-
38
-
39
-
40
-
41
-
42
-
43
-
44
-
45
-
46
-
47
-
48
-
49
-
50
-
51
-
52
-
53
-
54
-
55
-
56
-
57
-
58
-
59
-
60
-
61
-
62
-
63
-
64
-
65
-
66
-
67
-
68
-
69
-
70
-
71
-
72
-
73
-
74
-
75
-
76
-
77
-
78
-
79
-
80
-
81
-
82
-
83
-
84
-
85
-
86
-
87
-
88
-
89
-
90
-
91
-
92
-
93
-
94
-
95
-
96
-
97
-
98
-
99
-
100
-
101
-
102
-
 103
103 -
 104
104 -
 105
105 -
 106
106 -
 107
107 -
 108
108 -
 109
109 -
 110
110 -
 111
111 -
 112
112 -
 113
113 -
 114
114 -
 115
115 -
 116
116 -
 117
117 -
 118
118 -
 119
119 -
 120
120 -
 121
121 -
 122
122 -
 123
123 -
124
-
125
-
126
-
127
-
128
 |
 |

FINANCIAL SUMMARY P.111
Selling, General and Administrative In 2007, consolidated selling, general and administrative expens-
es, as a percent of consolidated net sales, decreased as compared to 2006, primarily due to higher sales
volume, acquisition efficiencies and administrative cost reductions. In 2006, consolidated selling,
general and administrative expenses, as a percent of consolidated net sales, increased as compared to
2005. The benefit from higher sales and acquisition efficiencies were more than offset by increased
brand investment, acquisition and integration costs and higher compensation expense.
Restructuring Restructuring initiatives resulted in charges of $61 million, $55 million and $57 million in
2007, 2006, and 2005, respectively, reflecting ongoing efforts to optimize our global operating platform.
These amounts have been identified as a separate component of operating profit, excluding Maytag sev-
erance and exit costs associated with the acquisition, and primarily relate to costs incurred to restruc-
ture the cooking and refrigeration platforms in Latin America, shift refrigeration capacity to lower
cost regions in Europe and North America and reorganize the salaried workforce throughout Europe.
Interest and Sundry Income (Expense) Interest and sundry income (expense) increased by $61 million
from expense of $2 million to expense of $63 million compared to 2006. The prior year results include
a $31 million gain on the sale of an investment while current year expense includes a $17 million
increase in legal reserves as well as higher non-income based taxes. Interest and sundry income
(expense) for 2006 decreased by $63 million from expense of $65 million to expense of $2 million
compared to 2005. Lower expense in 2006 was primarily due to the combination of a gain of
$31 million that was realized to reflect the sale of an investment and a charge of $21 million that was
recognized in 2005 to increase certain legal reserves.
Interest Expense Interest expense in 2007 increased $1 million as compared to 2006. For nine months
in 2006, we incurred higher debt levels associated with debt assumed and issued for the Maytag
acquisition which was offset by lower debt levels at lower interest rates during 2007. Interest expense
in 2006 increased $72 million as compared to 2005. The increase primarily reflects debt service
associated with debt assumed and issued to acquire Maytag.
Gain on Sale of Investment During 2007, we sold approximately 9million shares, or 7%, of Whirlpool
of India Limited and recorded a gain of approximately $7 million. This sale was executed to satisfy a
change in the Stock Exchange Board of India listing standards and regulations. Following the sale of
stock, our ownership interest in Whirlpool of India Limited is 75%.
Income Taxes The effective income tax rate was 14.5% in 2007, 20.4% in 2006 and 28.6% in 2005. The
rates and changes in rates result from a combination of certain discrete items recognized during the
year, dispersion of global income, tax credit availability, and tax planning activities. At the end of each
interim period, we make our best estimate of the effective tax rate expected to be applicable for the full
fiscal year and the impact of discrete items, if any, and adjust the quarterly rate, as necessary.
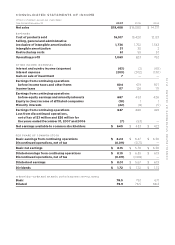
Earnings from Continuing Operations Earnings from continuing operations were $647 million in 2007
versus $486 million and $422 million in 2006 and 2005, respectively, due to the factors described above.
Discontinued Operations We classified the Hoover floor-care, Dixie-Narco vending systems, and Jade
commercial and residential businesses as discontinued operations during 2006. The decision to divest
these businesses allowed us to focus on our core appliance business.
Net Earnings Net earnings were $640 million in 2007 versus $433 million and $422 million in 2006
and 2005, respectively, due to the factors described above. Earnings were impacted by $7 million and
$53 million in losses from discontinued operations for 2007 and 2006, respectively.