Whirlpool 2007 Annual Report Download - page 124
Download and view the complete annual report
Please find page 124 of the 2007 Whirlpool annual report below. You can navigate through the pages in the report by either clicking on the pages listed below, or by using the keyword search tool below to find specific information within the annual report.-
 1
1 -
2
-
3
-
4
-
5
-
6
-
7
-
8
-
9
-
10
-
11
-
12
-
13
-
14
-
15
-
16
-
17
-
18
-
19
-
20
-
21
-
22
-
23
-
24
-
25
-
26
-
27
-
28
-
29
-
30
-
31
-
32
-
33
-
34
-
35
-
36
-
37
-
38
-
39
-
40
-
41
-
42
-
43
-
44
-
45
-
46
-
47
-
48
-
49
-
50
-
51
-
52
-
53
-
54
-
55
-
56
-
57
-
58
-
59
-
60
-
61
-
62
-
63
-
64
-
65
-
66
-
67
-
68
-
69
-
70
-
71
-
72
-
73
-
74
-
75
-
76
-
77
-
78
-
79
-
80
-
81
-
82
-
83
-
84
-
85
-
86
-
87
-
88
-
89
-
90
-
91
-
92
-
93
-
94
-
95
-
96
-
97
-
98
-
99
-
100
-
101
-
102
-
103
-
104
-
105
-
106
-
107
-
108
-
109
-
110
-
111
-
112
-
113
-
 114
114 -
 115
115 -
 116
116 -
 117
117 -
 118
118 -
 119
119 -
 120
120 -
 121
121 -
 122
122 -
 123
123 -
 124
124 -
 125
125 -
 126
126 -
 127
127 -
 128
128
 |
 |

FIVE-YEAR SELECTED FINANCIAL DATA P.122
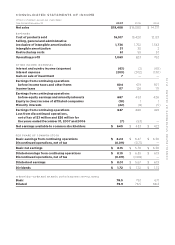
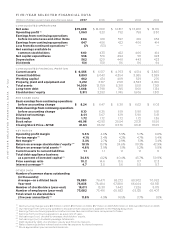
FIVE-YEAR SELECTED FINANCIAL DATA
(Millions of dollars except share and employee data) 2007 2006 2005 2004 2003
CONSOLIDATED OPERATIONS
Net sales $ 19,408 $ 18,080 $ 14,317 $ 13,220 $ 12,176
Operating profit (1) 1,063 823 792 758 830
Earnings from continuing operations
before income taxes and other items 804 619 597 616 652
Earnings from continuing operations 647 486 422 406 414
Loss from discontinued operations (2) (7) (53)———
Net earnings available to
common stockholders 640 433 422 406 414
Net capital expenditures 536 576 494 511 423
Depreciation 562 520 440 443 423
Dividends 134 130 116 116 94
CONSOLIDATED FINANCIAL POSITION
Current assets $ 6,555 $ 6,517 $ 4,763 $ 4,514 $ 3,865
Current liabilities 5,893 6,043 4,354 3,985 3,589
Working capital 662 474 409 529 276
Property, plant and equipment-net 3,212 3,157 2,511 2,583 2,456
Total assets 14,009 13,759 8,301 8,181 7,361
Long-term debt 1,668 1,798 745 1,160 1,134
Stockholders’ equity 3,911 3,283 1,745 1,606 1,301
PER SHARE DATA
Basic earnings from continuing operations
before accounting change $ 8.24 $ 6.47 $ 6.30 $ 6.02 $ 6.03
Diluted earnings from continuing operations
before accounting change 8.10 6.35 6.19 5.90 5.91
Diluted net earnings 8.01 5.67 6.19 5.90 5.91
Dividends 1.72 1.72 1.72 1.72 1.36
Book value 48.96 42.93 25.54 23.31 18.56
Closing Stock Price—NYSE 81.63 83.02 83.76 69.21 72.65
KEY RATIOS
Operating profit margin 5.5% 4.6% 5.5% 5.7% 6.8%
Pre-tax margin (3) 4.1% 3.4% 4.2% 4.7% 5.4%
Net margin (4) 3.3% 2.7% 2.9% 3.1% 3.4%
Return on average stockholders’ equity (5) 18.1% 15.7% 24.6% 30.3% 42.9%
Return on average total assets (6) 4.6% 3.9% 5.1% 5.2% 5.9%
Current assets to current liabilities 1.1 1.1 1.1 1.1 1.1
Total debt-appliance business
as a percent of invested capital (7) 34.5% 41.2% 40.4% 45.7% 50.9%
Price earnings ratio 10.2 14.6 13.5 11.7 12.3
Interest coverage (8) 4.7 3.8 5.6 5.8 5.7
OTHER DATA
Number of common shares outstanding
(in thousands):
Average—on a diluted basis 79,880 76,471 68,272 68,902 70,082
Year-end 75,835 78,484 67,880 66,604 68,931
Number of stockholders (year-end) 15,011 15,311 7,442 7,826 8,178
Number of employees (year-end) 73,682 73,416 65,682 68,125 68,407
Total return to shareholders
(five year annualized) (9) 11.8% 4.9% 14.5% 3.7% 8.1%
(1) Restructuring charges were $61 million in 2007, $55 million in 2006, $57 million in 2005, $15 million in 2004 and $3 million in 2003.
(2) Our earnings from continuing operations exclude certain dispositions adjacent to the Maytag acquisition.
(3) Earnings from continuing operations before income taxes and other items, as a percent of sales.
(4) Earnings from continuing operations, as a percent of sales.
(5) Net earnings (loss), divided by average stockholders’ equity.
(6) Net earnings (loss), divided by average total assets.
(7) Debt divided by debt, stockholders’ equity and minority interests.
(8) Ratio of earnings before interest and income tax expense to interest expense.
(9) Stock appreciation plus reinvested dividends.