Whirlpool 2007 Annual Report Download - page 111
Download and view the complete annual report
Please find page 111 of the 2007 Whirlpool annual report below. You can navigate through the pages in the report by either clicking on the pages listed below, or by using the keyword search tool below to find specific information within the annual report.-
 1
1 -
2
-
3
-
4
-
5
-
6
-
7
-
8
-
9
-
10
-
11
-
12
-
13
-
14
-
15
-
16
-
17
-
18
-
19
-
20
-
21
-
22
-
23
-
24
-
25
-
26
-
27
-
28
-
29
-
30
-
31
-
32
-
33
-
34
-
35
-
36
-
37
-
38
-
39
-
40
-
41
-
42
-
43
-
44
-
45
-
46
-
47
-
48
-
49
-
50
-
51
-
52
-
53
-
54
-
55
-
56
-
57
-
58
-
59
-
60
-
61
-
62
-
63
-
64
-
65
-
66
-
67
-
68
-
69
-
70
-
71
-
72
-
73
-
74
-
75
-
76
-
77
-
78
-
79
-
80
-
81
-
82
-
83
-
84
-
85
-
86
-
87
-
88
-
89
-
90
-
91
-
92
-
93
-
94
-
95
-
96
-
97
-
98
-
99
-
100
-
 101
101 -
 102
102 -
 103
103 -
 104
104 -
 105
105 -
 106
106 -
 107
107 -
 108
108 -
 109
109 -
 110
110 -
 111
111 -
 112
112 -
 113
113 -
 114
114 -
 115
115 -
 116
116 -
 117
117 -
 118
118 -
 119
119 -
 120
120 -
 121
121 -
122
-
123
-
124
-
125
-
126
-
127
-
128
 |
 |

FINANCIAL SUMMARY P.109
We have reallocated certain costs previously included within corporate administrative expense to
each of the respective regions. Regional results for 2006 and 2005 have been reclassified to reflect
these changes to conform to 2007 presentation.
Freight and warehousing costs previously included in selling, general and administrative expenses
in the Consolidated Statements of Income were reclassified to cost of sales, effective January 1, 2006.
Approximately $854 million was reclassified in 2005.
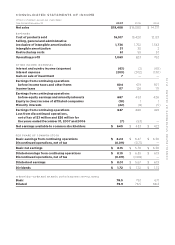
RESULTS OF OPERATIONS
For the year ended December 31, 2007, consolidated net sales were $19.4billion. Consolidated net
earnings from continuing operations were $647 million, or $8.10 per diluted share, increasing from
$486 million or $6.35 per diluted share for the year ended December 31, 2006. The increase in earnings
from continuing operations primarily reflects strong operating profit improvement within our
international businesses, cost-efficiency realization associated with the acquisition of Maytag, cost
based price increases and improved product mix, productivity improvements and strong cost con-
trols. Our results included $72 million of gains associated with asset sales in 2007, compared to $42
million of asset gains in the previous year period. Annual results were negatively impacted by
significantly higher material- and oil-related costs and lower shipments within North America.
Our international businesses experienced strong performance in 2007 driven by an 8.8% increase
in units sold. We experienced a 6.4% decrease in unit sales during 2007 in North America, primarily
resulting from a decline in appliance industry demand, lower original equipment manufacturer
(“OEM”) sales and lower share within our value and Maytag brands.
Significant regional trends were as follows:
• North America net sales increased in 2007 by 0.8% compared to 2006 due to a 7.6% increase in
the average unit selling price offset by a 6.4% decrease in units sold. We define the average unit selling
price as the amount that results from dividing consolidated net sales by units sold. The decrease in vol-
ume reflects reduced industry volume, lower OEM shipments and lower market share. The reduction
in volume in the U.S. was partially offset by higher demand in Canada and Mexico and a higher average
unit selling price due to product innovation and better product mix. Excluding the impact of the
Maytag acquisition, North America sales decreased 5%. North America sales increased in 2006 com-
pared to 2005 by 34.5% due primarily to the acquisition of Maytag. As compared to the prior year, unit
volumes increased 21.6%. The average unit selling price increased 10.6% compared to 2005 which also
contributed to higher net sales. Excluding the impact of the Maytag acquisition, net sales increased 4%
and unit volumes increased 2%. Organic volume and sales growth were driven by continued consumer
demand for new product innovations and improved Whirlpool and KitchenAid brand performance.
• Europe net sales increased in 2007 by 12.1% compared to 2006, primarily due to favorable foreign
currency, a higher average unit selling price and higher volume. The increase in sales due to price is a
result of an 8.3% higher average unit selling price as compared to prior year. The increase in volume is
driven by strong Whirlpool brand performance and the positive impact of new product offerings.
Excluding the impact of foreign currency, Europe net sales increased 2.9%. Net sales increased 7.1%
in 2006 as compared to 2005 primarily due to higher volume. Average selling price increased 2%
contributing to the remaining increase. Europe’s strong sales are driven by gains in market share,
new product introductions and improved product mix, primarily attributable to the Whirlpool brand
and expansion of our built-in appliance business. Excluding the impact of foreign currency, Europe
net sales increased 6.0% in 2006.
• Latin America net sales increased 27.7% in 2007 as compared to 2006, primarily due to higher
volume and a favorable impact from changes in foreign currency. As compared to prior year, the total
number of units sold increased 18.8%. The increase in volume growth is a result of strong growth in
the appliance industry, increased market share, strong economic conditions throughout the region
and cost based pricing. Excluding the impact of foreign currency, Latin America net sales increased
15.9% in 2007. Net sales increased 23.9% in 2006 as compared to 2005 due primarily to higher volumes.
Total units sold increased 22.9% compared to 2005 due primarily to continued strength in the Brazilian
economy, appliance market and market share gains that were a result of new product introductions.
Excluding the impact of foreign currency, Latin America net sales increased 16.0% in 2006.