Whirlpool 2007 Annual Report Download - page 119
Download and view the complete annual report
Please find page 119 of the 2007 Whirlpool annual report below. You can navigate through the pages in the report by either clicking on the pages listed below, or by using the keyword search tool below to find specific information within the annual report.-
 1
1 -
2
-
3
-
4
-
5
-
6
-
7
-
8
-
9
-
10
-
11
-
12
-
13
-
14
-
15
-
16
-
17
-
18
-
19
-
20
-
21
-
22
-
23
-
24
-
25
-
26
-
27
-
28
-
29
-
30
-
31
-
32
-
33
-
34
-
35
-
36
-
37
-
38
-
39
-
40
-
41
-
42
-
43
-
44
-
45
-
46
-
47
-
48
-
49
-
50
-
51
-
52
-
53
-
54
-
55
-
56
-
57
-
58
-
59
-
60
-
61
-
62
-
63
-
64
-
65
-
66
-
67
-
68
-
69
-
70
-
71
-
72
-
73
-
74
-
75
-
76
-
77
-
78
-
79
-
80
-
81
-
82
-
83
-
84
-
85
-
86
-
87
-
88
-
89
-
90
-
91
-
92
-
93
-
94
-
95
-
96
-
97
-
98
-
99
-
100
-
101
-
102
-
103
-
104
-
105
-
106
-
107
-
108
-
 109
109 -
 110
110 -
 111
111 -
 112
112 -
 113
113 -
 114
114 -
 115
115 -
 116
116 -
 117
117 -
 118
118 -
 119
119 -
 120
120 -
 121
121 -
 122
122 -
 123
123 -
 124
124 -
 125
125 -
 126
126 -
 127
127 -
 128
128
 |
 |

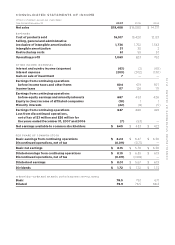
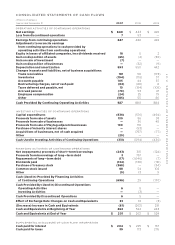
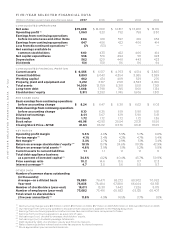
CONSOLIDATED STATEMENTS OF CASH FLOWS
(Millions of dollars)
Year ended December 31 2007 2006 2005
OPERATING ACTIVITIES OF CONTINUING OPERATIONS
Net earnings $ 640 $ 433 $ 422
Loss from discontinued operations 7 53 —
Earnings from continuing operations 647 486 422
Adjustments to reconcile earnings
from continuing operations to cash provided by
operating activities from continuing operations:
Equity in losses of affiliated companies, less dividends received 18 52
Gain on disposition of assets (65) (4) (39)
Gain on sale of investment (7) ——
Gain on disposition of businesses — (32) (9)
Depreciation and amortization 593 550 442
Changes in assets and liabilities, net of business acquisitions:
Trade receivables 181 50 (173)
Inventories (194) (118) 37
Accounts payable 105 44 87
Restructuring charges, net of cash paid (82) (80) 8
Taxes deferred and payable, net 10 (154) (105)
Accrued pension (70) 53 47
Employee compensation (24) 25 79
Other (185) 55 86
Cash Provided By Continuing Operating Activities 927 880 884
INVESTING ACTIVITIES OF CONTINUING OPERATIONS
Capital expenditures (536) (576) (494)
Proceeds from sale of assets 130 86 93
Proceeds from sale of businesses — 36 48
Proceeds from sale of Maytag adjacent businesses 100 110 —
Purchase of minority interest shares — (53) —
Acquisitions of businesses, net of cash acquired — (797) (77)
Other (25) ——
Cash Used In Investing Activities of Continuing Operations (331) (1,194) (430)
FINANCING ACTIVITIES OF CONTINUING OPERATIONS
Net (repayments) proceeds of short—term borrowings (243) 381 (124)
Proceeds from borrowings of long—term debt 3 757 —
Repayments of long—term debt (17) (1,046) (7)
Dividends paid (134) (130) (116)
Purchase of treasury stock (368) — (34)
Common stock issued 68 54 102
Other (5) 13 9
Cash (Used In) Provided By Financing Activities
of Continuing Operations (696) 29 (170)
Cash Provided By (Used In) Discontinued Operations
Operating Activities 6 8—
Investing Activities — (3) —
Cash Provided By Discontinued Operations 6 5—
Effect of Exchange Rate Changes on Cash and Equivalents 33 18 (3)
(Decrease) Increase in Cash and Equivalents (61) (262) 281
Cash and Equivalents at Beginning of Year 262 524 243
Cash and Equivalents at End of Year $ 201 $ 262 $ 524
SUPPLEMENTAL DISCLOSURE OF CASH FLOW INFORMATION
Cash paid for interest $ 204 $ 225 $ 137
Cash paid for taxes 39 173 276
CONSOLIDATED STATEMENTS OF CASH FLOWS P.117