Whirlpool 2007 Annual Report Download - page 116
Download and view the complete annual report
Please find page 116 of the 2007 Whirlpool annual report below. You can navigate through the pages in the report by either clicking on the pages listed below, or by using the keyword search tool below to find specific information within the annual report.-
 1
1 -
2
-
3
-
4
-
5
-
6
-
7
-
8
-
9
-
10
-
11
-
12
-
13
-
14
-
15
-
16
-
17
-
18
-
19
-
20
-
21
-
22
-
23
-
24
-
25
-
26
-
27
-
28
-
29
-
30
-
31
-
32
-
33
-
34
-
35
-
36
-
37
-
38
-
39
-
40
-
41
-
42
-
43
-
44
-
45
-
46
-
47
-
48
-
49
-
50
-
51
-
52
-
53
-
54
-
55
-
56
-
57
-
58
-
59
-
60
-
61
-
62
-
63
-
64
-
65
-
66
-
67
-
68
-
69
-
70
-
71
-
72
-
73
-
74
-
75
-
76
-
77
-
78
-
79
-
80
-
81
-
82
-
83
-
84
-
85
-
86
-
87
-
88
-
89
-
90
-
91
-
92
-
93
-
94
-
95
-
96
-
97
-
98
-
99
-
100
-
101
-
102
-
103
-
104
-
105
-
 106
106 -
 107
107 -
 108
108 -
 109
109 -
 110
110 -
 111
111 -
 112
112 -
 113
113 -
 114
114 -
 115
115 -
 116
116 -
 117
117 -
 118
118 -
 119
119 -
 120
120 -
 121
121 -
 122
122 -
 123
123 -
 124
124 -
 125
125 -
 126
126 -
127
-
128
 |
 |

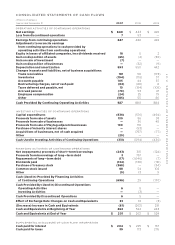
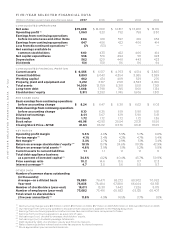
FINANCIAL SUMMARY P.114
We use foreign currency forward contracts, currency options and currency swaps to hedge the
price risk associated with firmly committed and forecasted cross-border payments and receipts
related to ongoing business and operational financing activities. Foreign currency contracts are
sensitive to changes in foreign currency exchange rates. At December 31, 2007, a 10% unfavorable
exchange rate movement in each currency in our portfolio of foreign currency contracts would have
resulted in an incremental unrealized loss of approximately $80 million, while a 10% favorable shift
would have resulted in an incremental unrealized gain of approximately $85 million. Consistent with
the use of these contracts to neutralize the effect of exchange rate fluctuations, such unrealized losses
or gains would be offset by corresponding gains or losses, respectively, in the re-measurement of the
underlying exposures.
We enter into commodity swap contracts to hedge the price risk associated with firmly committed
and forecasted commodities purchases that are not fixed directly through supply contracts. As of
December 31, 2007, a 10% favorable or unfavorable shift in commodity prices would have resulted in
an incremental $29 million gain or a $25 million loss related to these contracts.
We utilize interest rate swaps to hedge our interest rate risk. As of December 31, 2007, a 10% shift in
interest rates would have resulted in an incremental $1.0million gain or loss related to these contracts.
PERFORMANCE GRAPH
The graph below depicts the yearly dollar (and percentage) change in the cumulative total stockhold-
er return on our common stock with the cumulative total return of Standard & Poor’s (S&P)
Composite 500 Stock Index and the cumulative total return of the S&P Household Appliance Group
Index for the years 2003 through 2007.* The graph assumes $100 was invested on December 31, 2002,
in Whirlpool common stock, the S&P 500 and the S&P Household Appliance Group.
INDEXED RETURNS
Company / Index Base Period Years Ending
Dec02 Dec03 Dec04 Dec05 Dec06 Dec07
Whirlpool Corporation 100 142.31 139.14 172.45 174.35 174.62
S&P Composite 500 Stock Index 100 128.68 142.69 149.70 173.34 182.86
S&P Household Appliance
Group Index 100 120.09 148.39 157.98 163.61 158.87
2002 2003 2004 2005 2006 2007
$0
$100
$200
Whirlpool Corporation S&P 500 Index S&P 500 Household Appliances
* Cumulative total return is measured by dividing: (1) the sum of (a) the cumulative amount of the dividends for the measurement
period, assuming dividend reinvestment, and (b) the difference between share price at the end and the beginning of the
measurement period by (2) the share price at the beginning of the measurement period.