Whirlpool 2007 Annual Report Download - page 117
Download and view the complete annual report
Please find page 117 of the 2007 Whirlpool annual report below. You can navigate through the pages in the report by either clicking on the pages listed below, or by using the keyword search tool below to find specific information within the annual report.-
 1
1 -
2
-
3
-
4
-
5
-
6
-
7
-
8
-
9
-
10
-
11
-
12
-
13
-
14
-
15
-
16
-
17
-
18
-
19
-
20
-
21
-
22
-
23
-
24
-
25
-
26
-
27
-
28
-
29
-
30
-
31
-
32
-
33
-
34
-
35
-
36
-
37
-
38
-
39
-
40
-
41
-
42
-
43
-
44
-
45
-
46
-
47
-
48
-
49
-
50
-
51
-
52
-
53
-
54
-
55
-
56
-
57
-
58
-
59
-
60
-
61
-
62
-
63
-
64
-
65
-
66
-
67
-
68
-
69
-
70
-
71
-
72
-
73
-
74
-
75
-
76
-
77
-
78
-
79
-
80
-
81
-
82
-
83
-
84
-
85
-
86
-
87
-
88
-
89
-
90
-
91
-
92
-
93
-
94
-
95
-
96
-
97
-
98
-
99
-
100
-
101
-
102
-
103
-
104
-
105
-
106
-
 107
107 -
 108
108 -
 109
109 -
 110
110 -
 111
111 -
 112
112 -
 113
113 -
 114
114 -
 115
115 -
 116
116 -
 117
117 -
 118
118 -
 119
119 -
 120
120 -
 121
121 -
 122
122 -
 123
123 -
 124
124 -
 125
125 -
 126
126 -
 127
127 -
128
 |
 |

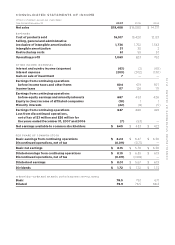
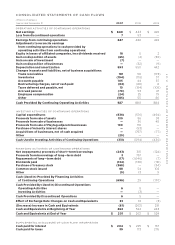
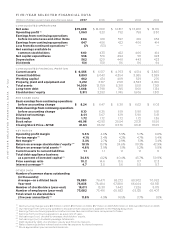
CONSOLIDATED STATEMENTS OF INCOME
(Millions of dollars, except per share data)
Year Ended December 31 2007 2006 2005
Net sales $19,408 $ 18,080 $ 14,317
EXPENSES
Cost of products sold 16,517 15,420 12,123
Selling, general and administrative
(exclusive of intangible amortization) 1,736 1,752 1,343
Intangible amortization 31 30 2
Restructuring costs 61 55 57
Operating profit 1,063 823 792
OTHER INCOME (EXPENSE)
Interest and sundry income (expense) (63) (2) (65)
Interest expense (203) (202) (130)
Gain on sale of investment 7 ——
Earnings from continuing operations
before income taxes and other items 804 619 597
Income taxes 117 126 171
Earnings from continuing operations
before equity earnings and minority interests 687 493 426
Equity in (loss) income of affiliated companies (18) 11
Minority interests (22) (8) (5)
Earnings from continuing operations 647 486 422
Loss from discontinued operations,
net of tax of $3 million and $26 million for
the years ended December 31, 2007 and 2006 (7) (53) —
Net earnings available to common stockholders $ 640 $ 433 $ 422
PER SHARE OF COMMON STOCK
Basic earnings from continuing operations $ 8.24 $ 6.47 $ 6.30
Discontinued operations, net of tax (0.09) (0.71) —
Basic net earnings $ 8.15 $ 5.76 $ 6.30
Diluted earnings from continuing operations $ 8.10 $ 6.35 $ 6.19
Discontinued operations, net of tax (0.09) (0.68) —
Diluted net earnings $ 8.01 $ 5.67 $ 6.19
Dividends $ 1.72 $1.72 $1.72
WEIGHTED—AVERAGE SHARES OUTSTANDING (IN MILLIONS)
Basic 78.5 75.1 67.1
Diluted 79.9 76.5 68.3
CONSOLIDATED STATEMENTS OF INCOME P.115